Trinity CCI Pro PlusWhat It Is
Trinity CCI Pro Plus is an innovative overlay indicator that reimagines the classic Commodity Channel Index (CCI) by plotting its levels directly on the price chart. No more separate oscillator panel—instead, you get dynamic price-based bands and lines for instant momentum insights.
What You See on the Chart
Orange line: The CCI zero line (20-period SMA of typical price, hlc3)—acts as the baseline.
Aqua line: Dynamic upper band at CCI = +100 (overbought threshold).
Purple line: Dynamic lower band at CCI = -100 (oversold threshold).
Optional thick purple line: The extra SMA of CCI (14-period smooth) scaled back to price—serves as a signal line for crossovers.
Optional outer zones: ±200 bands (aqua/purple extensions) for extreme momentum levels, often added as dotted or filled areas to spot blow-off tops/bottoms.
Key Differences from Regular CCI
Standard CCI lives in a lower pane with fixed horizontal lines at +100, 0, and -100, forcing you to split your focus. This version overlays everything on price: the bands curve with market volatility, the zero line becomes a moving average, and the extra SMA/signal line integrates seamlessly for price-action trading. Plus, it naturally supports outer ±200 zones without extra coding, making extremes visually pop.
How Traders Use It
Momentum breakouts: Buy when price closes above the +100 aqua band (or +200 for aggressive entries); sell below -100 purple (or -200).
Mean reversion: Fade touches on the bands—take profits if price rejects the +100/-100 levels, or watch for exhaustion at ±200.
Trend bias: Price above orange zero = bullish filter; below = bearish. Use the extra SMA for confirmation (e.g., price crossing above it signals upside).
Crossover signals: Price vs. the thick purple SMA line—bullish above, bearish below—pairs perfectly with band breaks.
Range trading: Treat ±100 bands as dynamic support/resistance; outer ±200 zones highlight potential breakout setups.
This setup shines in trending markets (e.g., stocks or forex on 1H/daily charts), turning CCI into a one-glance channel system. Start with the defaults, add the ±200 and extra SMA via simple code tweaks, and backtest for your style—it's versatile and reduces screen clutter dramatically.
More Info
The 20 period MA is the original and still the most common setting for CCI, and it is exactly what the creator of the CCI, Donald Lambert, published it in 1980 with these exact parameters:
Length: 20 periods
Constant: 0.015 (to make CCI fall between +100 and –100 about 70–80 % of the time)
Typical Price: hlc3 (or sometimes (high + low + close)/3)
Deviation measure: Mean Deviation (not standard deviation)
So the “Trinity CCI Pro Plus” you are using is 100 % faithful to Lambert’s original design when the length is set to 20.
"take profit" için komut dosyalarını ara

Psychologische LevelPSYCHOLOGICAL LEVELS INDICATOR FOR FOREX
This professional indicator automatically visualizes all important psychological price levels on Forex charts. Psychological levels are price zones where traders frequently react, as humans tend to gravitate toward round numbers.
MAIN FEATURES:
Automatic Level Detection: The indicator calculates and draws all relevant psychological levels based on the current currency pair
Visual Zones: Each level is displayed with a solid center line and a colored zone
Forex-Optimized: Automatically accounts for JPY pairs (0.01 pip) and standard pairs (0.0001 pip)
Fully Customizable: Colors, zone width, and line thickness can be individually adjusted
LEVEL TYPES:
00/000 Levels (e.g., 1.1000, 1.1100, 1.2000)
The most important psychological barriers
Traders frequently place stop-loss and take-profit orders at these levels
Strong support and resistance zones
50 Levels (e.g., 1.1050, 1.1150, 1.2050)
Secondary psychological levels
Located exactly midway between 00-levels
Important intermediate zones for profit-taking
25/75 Levels (e.g., 1.1025, 1.1075, 1.2025)
Optional activation for more detailed analysis
Quartile levels for more precise zones
Useful for scalping and short-term strategies
CONFIGURATION OPTIONS:
Zone Width in Pips: Determines the width of the colored zone around the center line (Default: 5 pips)
Zone Color: Fill color of the psychological zones (adjustable transparency)
Line Color: Color of the solid center lines
Line Width: Thickness of the center lines (1-5 pixels)
Level Selection: Individual selection of which level types to display
TRADING APPLICATIONS:
✓ Identification of potential support and resistance zones
✓ Placement of stop-loss and take-profit orders
✓ Recognition of price rejection zones
✓ Support for breakout strategies
✓ Enhanced risk management
✓ Optimization of entry and exit points
SPECIAL FEATURES:
Levels extend across the entire chart (extend.both)
Automatic adjustment to all Forex pairs
Optimized performance through intelligent calculation
Clean design without cluttered chart display
Compatible with all timeframes
SUITABLE FOR:
This indicator is suitable for day traders, swing traders, scalpers, and long-term Forex investors who want to incorporate psychological price levels into their trading strategy.

Session Opening Range Breakout (ORBO)This strategy automates a classic Opening Range Breakout (ORBO) approach: it builds a price range for the first minutes after the market opens, then looks for strong breakouts above or below that range to catch early directional moves.
Concept
The idea behind ORBO is simple:
The first minutes after the session open are often highly informative.
Price forms an “opening range” that acts as a mini support/resistance zone.
A clean breakout beyond this zone can lead to high-momentum moves.
This script turns that logic into a fully backtestable strategy in TradingView.
How the strategy works
Opening Range Session
Default session: 09:30–09:50 (exchange time)
During this window, the script tracks:
orHigh → highest high within the session
orLow → lowest low within the session
This forms your Opening Range for the day.
Breakout Logic (after the window ends)
Once the defined session ends:
Long Entry:
If the close crosses above the Opening Range High (orHigh),
→ strategy.entry("OR Long", strategy.long) is triggered.
Short Entry:
If the close crosses below the Opening Range Low (orLow),
→ strategy.entry("OR Short", strategy.short) is triggered.
Only one opening range per day is considered, which keeps the logic clean and easy to interpret.
Daily Reset
At the start of a new trading day, the script resets:
orHigh := na
orLow := na
A fresh Opening Range is then built using the next session’s 09:30–09:50 candles.
This ensures entries are always based on today’s structure, not yesterday’s.
Visuals & Inputs
Inputs:
Opening range session → default: "0930-0950"
Show OR levels → toggle visibility of OR High / Low lines
Fill range body → optional shaded zone between OR High and OR Low
Chart visuals:
A green line marks the Opening Range High.
A red line marks the Opening Range Low.
Optional yellow fill highlights the entire OR zone.
Background shading during the session shows when the range is currently being built.
These visuals make it easy to see:
Where the OR sits relative to current price
How clean / noisy the breakout was
How often price respects or rejects the opening zone
Backtesting & Optimization
Because this is written as a strategy():
You can use TradingView’s Strategy Tester to view:
Win rate
Net profit
Drawdown
Profit factor
Equity curve
Ideas to experiment with:
Change the session window (e.g., 09:15–09:45, 10:00–10:30)
Apply to different:
Markets: indices, FX, crypto, stocks
Timeframes: 1m / 5m / 15m
Add your own:
Stop Loss & Take Profit levels
Time filters (only trade certain days / times)
Volatility filters (e.g., ATR, range size thresholds)
Higher-timeframe trend filter (e.g., only take longs above 200 EMA)

[CT] ATR Ratio MTFThis indicator is an enhanced, multi-timeframe version of the original “ATR ratio” by RafaelZioni. Huge thanks to RafaelZioni for the core concept and base logic. The script still combines an ATR-based ratio (Z-score style reading of where price sits within its recent ATR envelope) with an ATR Supertrend, but expands it into a more flexible trade-decision and visual context tool.
The ATR ratio is normalized so you can quickly see when price is pressing into extended bullish or bearish territory, while the Supertrend defines directional bias and a dynamic support-resistance trail. You can choose any higher timeframe in the settings, allowing you to run the ATR ratio and Supertrend from a larger anchor timeframe while trading on a lower chart.
Upgrades include a full Pine Script v6 rewrite, multi-timeframe support for both the ATR ratio and Supertrend, user-controlled colors for the Supertrend in bull and bear modes, and optional bar coloring so price bars automatically reflect Supertrend direction. Entry, pyramiding and take-profit logic from the original script are preserved, giving you a familiar framework with more control over timeframe, visuals and trend bias.
This indicator is designed to give you a clean directional framework that blends volatility, trend, and timing into one view. The ATR ratio side of the script shows you where price sits inside a recent ATR-based envelope. When the ATR ratio pushes up and sustains above the bullish threshold, it signals that price is trading in an extended, momentum-driven zone relative to recent volatility. When it drops and holds below the bearish threshold, it shows the opposite: sellers have pushed price down into an extended bearish zone. The optional background coloring simply makes these bullish and bearish environments easier to see at a glance.
On top of that, the Supertrend and bar colors tell you what side of the market to favor. The Supertrend is calculated from ATR on whatever timeframe you choose in the settings. If you set the MTF input to a higher timeframe, the Supertrend and ATR ratio become your higher time frame bias while you trade on a lower chart. When price is above the MTF Supertrend, the line uses your bullish color and, if bar coloring is enabled, candles adopt your bullish bar color. That is your “long only” environment: you generally look for buys when price is above the Supertrend and the ATR ratio is either turning up from neutral or already in a bullish zone. When price is below the MTF Supertrend, the line uses your bearish color and candles can shift to your bearish bar color; that is where you focus on shorts, especially when the ATR ratio is rolling over or holding in the bearish zone.
The built-in long and short conditions are meant as signal prompts, not rigid rules. Long signals fire when the ATR ratio crosses up through a positive level while the Supertrend is bullish. Short signals fire when the ATR ratio crosses down through a negative level while the Supertrend is bearish. The script tracks how many longs or shorts have been taken in sequence (pyramiding) and will only allow a new signal up to the limit you set, so you can control how aggressively you stack positions in a trend. The take-profit logic then watches the percentage move from your last entry and flags “TP” when that move has reached your take-profit percent, helping you standardize exits instead of eyeballing them bar by bar.
In practice you typically start by choosing your anchor timeframe for the MTF setting, for example a 1-hour or 4-hour Supertrend and ATR ratio while watching a 5-minute or 15-minute chart. You then use the Supertrend direction and bar colors as your bias filter, only taking signals in the direction of the trend, and you use the ATR ratio behavior to judge whether you are entering into strength, fading an extreme, or trading inside a neutral consolidation. Over time this gives you a consistent way to answer three questions on every chart: which side am I allowed to trade, how extended is price within its recent volatility, and where are my structured entries and exits based on that framework.

Dr. Barbara Star: Dual Strategies Combined [Merged] - geminiDr. Barbara Star: Dual Strategy Suite (Merged)
Overview
This script integrates two distinct but complementary trading methodologies developed by Dr. Barbara Star: "Capture Direction & Momentum" and "Profit with Dual Oscillators & Bands." While both strategies utilize price channels to filter noise, they approach entry and exit timing from different angles—one focusing on momentum shifts (Stochastic/EMA) and the other on cyclical price deviations (DPO/Bollinger Bands).
This tool allows the user to run either strategy independently or combine them to find high-confluence setups where momentum and cyclical structure align.
Strategy A: Capture Direction & Momentum
Source: Capture Direction And Momentum
1. Purpose & Theory
The goal of this method is to filter out the "noise" of choppy markets and identify the specific point where price direction aligns with momentum strength. It moves away from trying to catch exact tops or bottoms and instead focuses on catching the "meat" of the trend (continuation).
2. Implementation
Structure (The Channel): A 13-period SMA of the Highs and Lows creates a "No Trade Zone". When price is inside this channel, the market is considered directionless.
Direction (5 EMA): A fast 5-period EMA acts as a directional trigger. When it breaks outside the SMA channel, it signals acceleration.
Momentum (Modified Stochastic): A Slow Stochastic (14,2) is used, but with a crucial modification: the overbought/oversold levels are shifted to 40 and 60 (instead of 20/80).
3. How to Use It
The "Trend Zones" (Background Colors):
Green Background (Bullish): The 5 EMA is above the channel AND the Stochastic is > 60. This is the "Go" zone.
Red Background (Bearish): The 5 EMA is below the channel AND the Stochastic is < 40.
Yellow Background: The "No Trade Zone." The price is consolidating, or the indicators disagree.
The Continuation Signal (Marked by "U" or "D"):
Why it matters: This is the most powerful setup in the system. It detects when price pulls back (retracement) but momentum remains strong.
The Signal: If the 5 EMA dips back into the SMA channel (weakness) but the Stochastic stays above 60 (strength), a blue "U" (Up) marker appears. This indicates the pullback is likely a buying opportunity, not a reversal. Conversely, a yellow "D" appears in downtrends if Stoch stays below 40.
Exits (Marked by "X"):
Signals to take profit when the 5 EMA closes back inside the channel and the Stochastic crosses back into the neutral 40–60 zone.
Strategy B: Dual Oscillators & Bands
Source: Profit With Dual Oscillators & Bands
1. Purpose & Theory
This strategy uses "Dual Bollinger Bands" to define the volatility structure of the trend and "Dual Detrended Price Oscillators" (DPO) to time the entries based on cycle shifts.
2. Implementation
Structure (Dual Bands):
Inner Bands (1 SD): These define the "Trend Channel." Strong trends tend to ride between the 1 SD and 3 SD bands.
Outer Bands (3 SD): These represent extremes (containing 99.5% of price action). Hits here often signal exhaustion.
Timing (Dual DPOs):
Long Oscillator (DPO 20): Identifies the broader trend direction (Positive = Bullish).
Short Oscillator (DPO 9): Identifies shorter-term timing and potential divergences.
3. How to Use It
Identifying the Trend State:
Strong Uptrend: Price holds above the Upper Inner Band (1 SD).
Strong Downtrend: Price holds below the Lower Inner Band (1 SD).
Transition/Neutral: Price is stuck between the Upper and Lower Inner bands.
Entry Signals (Triangles on Chart & Circles in Pane):
Aggressive Entry: When the fast DPO 9 crosses zero. This signals early momentum shifts.
Conservative Entry: Wait for the slow DPO 20 to cross zero, confirming the broader trend has shifted.
Visuals: The script plots triangles on the main chart when these cross. In the lower pane, a Blue Circle indicates a bullish cross and a Yellow Circle indicates a bearish cross.
Continuation Setup:
Similar to Strategy A, look for moments where the DPO 9 dips below zero (pullback) while the DPO 20 remains above zero (trend intact). This is often a reload opportunity.
Combined Mode: The "Power Couple"
When selecting "Both" in the settings, the indicator merges these tools for maximum confirmation:
Visual filtering: The lower pane automatically scales the DPO lines to fit inside the 0–100 Stochastic range (centering the DPO zero line at 50). This allows you to read both momentum and cycles in a single glance.
Confluence Trading:
Look for the Background to turn Green (Strategy A Trend) coincident with a Blue Triangle/Circle (Strategy B Momentum Cross).
Use the Inner Bollinger Bands (Strategy B) as your trailing stop-loss while riding the SMA Channel (Strategy A) trend.
Reference Settings
Strategy A: SMA Channel (13), EMA (5), Stochastic (14, 2, 40/60 levels).
Strategy B: Bollinger Bands (20 SMA, 1.0 & 3.0 deviations), DPO (9 & 20).
Sources: of the methodologies
1-Stocks & Commodities V. 32:7 (10-16): Profit With Dual Oscillators & Bands by Barbara Star, PhD
2-Stocks & Commodities V. 43:12 (8–12): Capture Direction And Momentum by Barbara Star, PhD

AB=CD Fibonacci Strategy (One Trade at a Time)
AB=CD Fibonacci Strategy - Harmonic Pattern Trading Bot
Description
An automated trading strategy that identifies and trades the classic AB=CD harmonic pattern, one of the most reliable geometric price formations in technical analysis. This strategy detects perfectly proportioned Fibonacci retracement setups and executes trades with precise risk-reward management.
How It Works
The indicator scans for the AB=CD pattern structure:
Leg AB: Initial swing from pivot point A to pivot point B
Leg BC: Retracement to point C (customizable Fibonacci levels)
Leg CD: Mirror projection equal to the AB leg length
When price touches point D, the strategy automatically enters a position with predefined take-profit and stop-loss levels based on your risk-reward ratio.
Key Features
One Trade at a Time: Ensures disciplined position management by allowing only one active trade per pattern
Customizable Fibonacci Retracement: Set your preferred retracement range for point C (default 50% - 78.6%)
Risk-Reward Control: Adjust stop-loss and take-profit multiples to match your trading plan
Visual Pattern Display: Clear labeling of A, B, C, D points with pattern lines for easy identification
Both Directions: Identifies bullish and bearish AB=CD patterns automatically
Ideal For
Swing traders on higher timeframes (4H, Daily, Weekly)
Harmonic pattern traders seeking automation
Traders wanting precise entry and exit rules based on Fibonacci geometry
Those looking to reduce emotional trading and increase consistency
Default Settings Optimized For
NASDAQ futures and currency pairs
Medium timeframe analysis
Conservative risk management (10% position size per trade)

Sequential Exhaustion 9/13 [Crypto Filter] - PyraTimeConcept: The Exhaustion Meter
This indicator is a customized version of the Sequential count, a powerful tool used by institutional traders to measure buyer and seller exhaustion. It looks for a sequence of 9 (Setup) or 13 (Countdown) consecutive candles that satisfy specific price criteria.
The purpose is simple: To tell you when a trend has run out of fuel.
Key Differentiators (The Value)
Due to the high volatility of the crypto market, standard Sequential indicators print too many false signals ("13s") during a strong trend. This custom version solves that problem with two core filters:
1. Trend Filter (EMA 200): If enabled, the indicator will automatically hide all Sell signals when the price is above the 200 EMA, protecting the user from shorting an uptrend (and vice-versa).
2. Color Confirmation: It will not print a signal unless the closing candle color matches the direction (e.g., no Red 13 sell signals on Green Candles). This drastically cleans up the chart.
Understanding the Numbers
The numbers appearing above and below the candles are your exhaustion meter.
* The "9" (Setup): Indicates a short-term trend is nearing exhaustion.
* The "13" (Countdown): Indicates the trend is statistically complete and a reversal is highly probable.
The Actionable Strategy (The PyraTime Rule)
This indicator is designed to be your Exit Tool. Use it to determine when to take profit from an existing trade.
* Example: You enter Long at the GPM Time Line. When the PyraTD prints a Red 9 or Red 13, you take profit immediately.
Final Note
Use the integrated visibility settings to turn off signals (e.g., hide 9s or Sells) to customize the view to your preferred trading style.
Disclaimer: This tool measures mathematical exhaustion and is part of the PyraTime system. It is not financial advice.

Superior-Range Bound Renko - Alerts - 11-29-25 - Signal LynxSuperior-Range Bound Renko – Alerts Edition with Advanced Risk Management Template
Signal Lynx | Free Scripts supporting Automation for the Night-Shift Nation 🌙
1. Overview
This is the Alerts & Indicator Edition of Superior-Range Bound Renko (RBR).
The Strategy version is built for backtesting inside TradingView.
This Alerts version is built for automation: it emits clean, discrete alert events that you can route into webhooks, bots, or relay engines (including your own Signal Lynx-style infrastructure).
Under the hood, this script contains the same core engine as the strategy:
Adaptive Range Bounding based on volatility
Renko Brick Emulation on standard candles
A stack of Laguerre Filters for impulse detection
K-Means-style Adaptive SuperTrend for trend confirmation
The full Signal Lynx Risk Management Engine (state machine, layered exits, AATS, RSIS, etc.)
The difference is in what we output:
Instead of placing historical trades, this version:
Plots the entry and RM signals in a separate pane (overlay = false)
Exposes alertconditions for:
Long Entry
Short Entry
Close Long
Close Short
TP1, TP2, TP3 hits (Staged Take Profit)
This makes it ideal as the signal source for automated execution via TradingView Alerts + Webhooks.
2. Quick Action Guide (TL;DR)
Best Timeframe:
4H and above. This is a swing-trading / position-trading style engine, not a micro-scalper.
Best Assets:
Volatile but structured markets, e.g.:
BTC, ETH, XAUUSD (Gold), GBPJPY, and similar high-volatility majors or indices.
Script Type:
indicator() – Alerts & Visualization Only
No built-in order placement
All “orders” are emitted as alerts for your external bot or manual handling
Strategy Type:
Volatility-Adaptive Trend Following + Impulse Detection
using Renko-like structure and multi-layer Laguerre filters.
Repainting:
Designed to be non-repainting on closed candles.
The underlying Risk Management engine is built around previous-bar data (close , high , low ) for execution-critical logic.
Intrabar values can move while the bar is forming (normal for any advanced signal), but once a bar closes, the alert logic is stable.
Recommended Alert Settings:
Condition: one of the built-in signals (see section 3.B)
Options: “Once Per Bar Close” is strongly recommended for automation
Message: JSON, CSV, or simple tokens – whatever your webhook / relay expects
3. Detailed Report: How the Alerts Edition Works
A. Relationship to the Strategy Version
The Alerts Edition shares the same internal logic as the strategy version:
Same Adaptive Lookback and volatility normalization
Same Range and Close Range construction
Same Renko Brick Emulator and directional memory (renkoDir)
Same Fib structures, Laguerre stack, K-Means SuperTrend, and Baseline signals (B1, B2)
Same Risk Management Engine and layered exits
In the strategy script, these signals are wired into strategy.entry, strategy.exit, and strategy.close.
In the alerts script:
We still compute the final entry/exit signals (Fin, CloseEmAll, TakeProfit1Plot, etc.)
Instead of placing trades, we:
Plot them for visual inspection
Expose them via alertcondition(...) so that TradingView can fire alerts.
This ensures that:
If you use the same settings on the same symbol/timeframe, the Alerts Edition and Strategy Edition agree on where entries and exits occur.
(Subject only to normal intrabar vs. bar-close differences.)
B. Signals & Alert Conditions
The alerts script focuses on discrete, automation-friendly events.
Internally, the main signals are:
Fin – Final entry decision from the RM engine
CloseEmAll – RM-driven “hard close” signal (for full-position exits)
TakeProfit1Plot / 2Plot / 3Plot – One-time event markers when each TP stage is hit
On the chart (in the separate indicator pane), you get:
plot(Fin) – where:
+2 = Long Entry event
-2 = Short Entry event
plot(CloseEmAll) – where:
+1 = “Close Long” event
-1 = “Close Short” event
plot(TP1/TP2/TP3) (if Staged TP is enabled) – integer tags for TP hits:
+1 / +2 / +3 = TP1 / TP2 / TP3 for Longs
-1 / -2 / -3 = TP1 / TP2 / TP3 for Shorts
The corresponding alertconditions are:
Long Entry
alertcondition(Fin == 2, title="Long Entry", message="Long Entry Triggered")
Fire this to open/scale a long position in your bot.
Short Entry
alertcondition(Fin == -2, title="Short Entry", message="Short Entry Triggered")
Fire this to open/scale a short position.
Close Long
alertcondition(CloseEmAll == 1, title="Close Long", message="Close Long Triggered")
Fire this to fully exit a long position.
Close Short
alertcondition(CloseEmAll == -1, title="Close Short", message="Close Short Triggered")
Fire this to fully exit a short position.
TP 1 Hit
alertcondition(TakeProfit1Plot != 0, title="TP 1 Hit", message="TP 1 Level Reached")
First staged take profit hit (either long or short). Your bot can interpret the direction based on position state or message tags.
TP 2 Hit
alertcondition(TakeProfit2Plot != 0, title="TP 2 Hit", message="TP 2 Level Reached")
TP 3 Hit
alertcondition(TakeProfit3Plot != 0, title="TP 3 Hit", message="TP 3 Level Reached")
Together, these give you a complete trade lifecycle:
Open Long / Short
Optionally scale out via TP1/TP2/TP3
Close remaining via Close Long / Close Short
All while the Risk Management Engine enforces the same logic as the strategy version.
C. Using This Script for Automation
This Alerts Edition is designed for:
Webhook-based bots
Execution relays (e.g., your own Lynx-Relay-style engine)
Dedicated external trade managers
Typical setup flow:
Add the script to your chart
Same symbol, timeframe, and settings you use in the Strategy Edition backtests.
Configure Inputs:
Longs / Shorts enabled
Risk Management toggles (SL, TS, Staged TP, AATS, RSIS)
Weekend filter (if you do not want weekend trades)
RBR-specific knobs (Adaptive Lookback, Brick type, ATR vs Standard Brick, etc.)
Create Alerts for Each Event Type You Need:
Long Entry
Short Entry
Close Long
Close Short
TP1 / TP2 / TP3 (optional, if your bot handles partial closes)
For each:
Condition: the corresponding alertcondition
Option: “Once Per Bar Close” is strongly recommended
Message:
You can use structured JSON or a simple token set like:
{"side":"long","event":"entry","symbol":"{{ticker}}","time":"{{timenow}}"}
or a simpler text for manual trading like:
LONG ENTRY | {{ticker}} | {{interval}}
Wire Up Your Bot / Relay:
Point TradingView’s webhook URL to your execution engine
Parse the messages and map them into:
Exchange
Symbol
Side (long/short)
Action (open/close/partial)
Size and risk model (this script does not position-size for you; it only signals when, not how much.)
Because the alerts come from a non-repainting, RM-backed engine that you’ve already validated via the Strategy Edition, you get a much cleaner automation pipeline.
D. Repainting Protection (Alerts Edition)
The same protections as the Strategy Edition apply here:
Execution-critical logic (trailing stop, TP triggers, SL, RM state changes) uses previous bar OHLC:
open , high , low , close
No security() with lookahead or future-bar dependencies.
This means:
Alerts are designed to fire on states that would have been visible at bar close, not on hypothetical “future history.”
Important practical note:
Intrabar: While a bar is forming, internal conditions can oscillate.
Bar Close: With “Once Per Bar Close” alerts, the fired signal corresponds to the final state of the engine for that candle, matching your Strategy Edition expectations.
4. For Developers & Modders
You can treat this Alerts script as an ”RM + Alert Framework” and inject any signal logic you want.
Where to plug in:
Find the section:
// BASELINE & SIGNAL GENERATION
You’ll see how B1 and B2 are built from the RBR stack and then combined:
baseSig = B2
altSig = B1
finalSig = sigSwap ? baseSig : altSig
To use your own logic:
Replace or wrap the code that sets baseSig / altSig with your own conditions:
e.g., RSI, MACD, Heikin Ashi filters, candle patterns, volume filters, etc.
Make sure your final decision is still:
2 → Long / Buy signal
-2 → Short / Sell signal
0 → No trade
finalSig is then passed into the RM engine and eventually becomes Fin, which:
Drives the Long/Short Entry alerts
Interacts with the RM state machine to integrate properly with AATS, SL, TS, TP, etc.
Because this script already exposes alertconditions for key lifecycle events, you don’t need to re-wire alerts each time — just ensure your logic feeds into finalSig correctly.
This lets you use the Signal Lynx Risk Management Engine + Alerts wrapper as a drop-in chassis for your own strategies.
5. About Signal Lynx
Automation for the Night-Shift Nation 🌙
Signal Lynx builds tools and templates that help traders move from:
“I have an indicator” → “I have a structured, automatable strategy with real risk management.”
This Superior-Range Bound Renko – Alerts Edition is the automation-focused companion to the Strategy Edition. It’s designed for:
Traders who backtest with the Strategy version
Then deploy live signals with this Alerts version via webhooks or bots
While relying on the same non-repainting, RM-driven logic
We release this code under the Mozilla Public License 2.0 (MPL-2.0) to support the Pine community with:
Transparent, inspectable logic
A reusable Risk Management template
A reference implementation of advanced adaptive logic + alerts
If you are exploring full-stack automation (TradingView → Webhooks → Exchange / VPS), keep Signal Lynx in your search.
License: Mozilla Public License 2.0 (Open Source).
If you build improvements or helpful variants, please consider sharing them back with the community.

Super-AO Engine - Sentiment Ribbon - 11-29-25Super-AO Sentiment Ribbon by Signal Lynx
Overview:
The Super-AO Sentiment Ribbon is the visual companion to the Super-AO Strategy Suite.
While the main strategy handles the complex mathematics of entries and risk management, this tool provides a simple "Traffic Light" visual at the top of your chart to gauge the overall health of the market.
How It Works:
This indicator takes the core components of the Super-AO strategy (The SuperTrend and the Awesome Oscillator), calculates the spread between them and the current price, and generates a normalized "Sentiment Score."
Reading the Colors:
🟢 Lime / Green: Strong Upward Momentum. Ideally, you only want to take Longs here.
🟤 Olive / Yellow: Trend is weakening. Be careful with new entries, or consider taking profit.
⚪ Gray: The "Kill Zone." The market is chopping sideways. Automated strategies usually suffer here.
🟠 Orange / Red: Strong Downward Momentum. Ideally, you only want to take Shorts here.
Integration:
This script uses the same default inputs as our Super-AO Strategy Template and Alerts Template. Use them together to confirm your automated entries visually.
About Signal Lynx:
Free Scripts supporting Automation for the Night-Shift Nation 🌙
(www.signallynx.com)

Psychological levels [Kodologic] Psychological levels
Markets are not random, they are driven by human psychology and algorithmic order flow. A well-known phenomenon in trading is the "Whole Number Bias" — the tendency for price to react significantly at clean, round numbers (e.g., Bitcoin at $95,000 or EURUSD at 1.0500).
Manually drawing horizontal lines at every round number is tedious, clutters your object tree, and distracts you from analyzing price action.
Psychological levels Numbers is a workflow utility designed to solve this problem. It automatically projects a clean, customizable grid of key price levels onto your chart, helping you instantly identify areas where liquidity and orders are likely to cluster.
Why This Indicator Helps Traders :
Professional traders know that "00" and "50" levels act as magnets for price. Here is how this tool assists in your analysis:
1. Institutional Footprints : Large institutions and bank algorithms often execute orders at whole numbers to simplify accounting. This script highlights these potential liquidity zones automatically.
2. Support & Resistance Discovery: You will often notice price wicking or reversing exactly on these grid lines. This helps in spotting natural support and resistance without needing complex technical analysis.
3. Cognitive Load Reduction: Instead of calculating where the next "major level" is, the grid is visually present, allowing you to focus on candlestick patterns and market structure.
Features :
Dynamic Calculation : The grid updates automatically as price moves, you never have to redraw lines.
Zero Clutter : The lines are drawn using code, meaning they do not appear in your manual drawing tools list or clutter your object tree.
Fully Customizable Step : You define what constitutes a "Round Number" for your specific asset class (Forex, Crypto, Indices, or Stocks).
Visual Control : Adjust line styles (Solid, Dotted, Dashed), colors, and transparency to keep your chart aesthetic and readable.
How to Use in Your Strategy :
1. Target Setting (Take Profit)
If you are in a long position, use the next upper grid line as a logical Take Profit area. Price often gravitates toward these whole numbers before reversing or consolidating.
2. Stop Loss Placement
Avoid placing Stop Losses exactly on a round number, as these are often "stop hunted." Instead, use the grid to visualize the level and place your stop slightly *below* or *above* the round number for better protection.
3. Confluence Trading
Do not use these lines in isolation. Look for Confluence :
Example: If a Fibonacci 61.8% level lines up exactly with a Round Number grid line, that level becomes a high-probability reversal zone.
Settings Guide (Important)
Since every asset is priced differently, you must adjust the "levels Step Size" to match your instrument:
Forex (e.g., EURUSD, GBPUSD): Set Step Size to `0.0050` (50 pips) or `0.0100` (100 pips).
Crypto (e.g., BTCUSD): Set Step Size to `500` or `1000`.
Indices (e.g., US30, SPX500): Set Step Size to `100` or `500`.
Gold (XAUUSD):** Set Step Size to `10`.
Disclaimer: This tool is for educational and visual aid purposes only. It does not provide buy or sell signals. Always manage your risk.

Apex Liquidity & Trend Architect [Smart]Trading charts often suffer from two problems: Noise (too many false signals in chopping markets) and Clutter (too many old lines and zones obscuring price).
ALTA solves both. It is a streamlined, institutional-grade trend system that uses ADX filtering to silence weak signals and Time-Decay logic to automatically clean up old liquidity zones. It respects your screen real estate, showing you only what matters, right now.
1. The "Smart" Engine
Unlike standard trend indicators that repaint or clutter the screen, ALTA introduces three key innovations:
A. Hull Moving Average (HMA) Baseline
We have upgraded the core engine to use the Hull Moving Average. HMA is significantly faster and smoother than standard EMAs or SMAs, reducing lag on entry signals.
Note: You can switch back to WMA or SMA in the settings if you prefer a slower pace.
B. ADX Momentum Filtering
Quality over Quantity: The script monitors the ADX (Average Directional Index). If the trend flips, but the ADX is below 20 (weak trend), the signal is blocked.
This prevents you from getting chopped out during sideways accumulation phases. You only get a "BUY" or "SELL" label when there is actual momentum behind the move.
C. Adaptive Gradient Coloring
The candles do not just turn Green or Red. They change intensity based on trend strength.
Bright/Vivid Candles: Strong Momentum (High ADX).
Dark/Dull Candles: Weak Momentum (Low ADX).
Visual Cue: If the candles are fading into the background, stay out of the market.
2. Self-Cleaning Liquidity Zones
Most support/resistance indicators leave old boxes on the chart forever. ALTA uses a Decay Protocol.
Volume Validation: Supply/Demand zones are only drawn if the pivot point had volume significantly higher than average (configurable).
Mitigation: If price wicks through a zone, it is deleted instantly.
Time Decay (New): If a zone is not hit within a set number of bars (Default: 100), it automatically deletes itself. This keeps your chart focused on fresh levels only.
3. The Minimalist HUD
A simplified dashboard in the corner of your screen provides an instant health check of the market:
ALTA Label: System Status.
Trend: BULL / BEAR / WAIT (Squeeze).
Power: WEAK / SOLID / STRONG (Based on ADX).
4. How to Trade (The Strategy)
The High-Probability Buy
Trend: Ribbon is Green.
Candles: Candles are Bright Green (indicating High ADX Strength).
Signal: A "BUY" label appears (confirmed by ADX filter).
Liquidity: Price is bouncing off a valid Demand Zone.
The High-Probability Sell
Trend: Ribbon is Red.
Candles: Candles are Bright Red (indicating High ADX Strength).
Signal: A "SELL" label appears.
Liquidity: Price is rejecting off a valid Supply Zone.
When to STAY OUT
The Squeeze: If the ribbon turns Grey/White, volatility is compressing. Wait for the breakout.
The Fade: If the candles are dark/translucent, momentum is dying. Take profits or wait for a fresh impulse.
5. Settings & Customization
Basis Type: Switch between HMA (Fast), WMA (Standard), or SMA (Slow).
Signal Quality Filter: Toggle the ADX filter on/off.
Zone Life: How many bars should a Supply/Demand zone survive before decaying?
Tooltips: Every single setting in this script includes a descriptive tooltip. Hover over the "i" icon in the settings menu for detailed explanations of every feature.
Disclaimer
This indicator is for educational purposes only. Past performance (even with smart filtering) does not guarantee future results. Always manage your risk.

Mustang Algo - Momentum Trend Zone Backtest🐎 MUSTANG ALGO - Momentum Trend Zone Strategy
A complete trading system combining MACD momentum analysis with visual trend zones, full backtesting capabilities, and advanced risk management tools.
══════════════════════════════════════════════════════════════════════════
🔹 OVERVIEW
Mustang Algo transforms traditional MACD analysis into a powerful visual trading system. It instantly identifies market bias through colored background zones and provides clear entry/exit signals with customizable stop loss and take profit management.
══════════════════════════════════════════════════════════════════════════
🔹 KEY FEATURES
✅ Visual Trend Zones (Green = Bullish | Red = Bearish)
✅ Clear Buy/Sell Triangles on Chart
✅ Full Backtesting Engine
✅ Multiple Stop Loss Types
✅ Multiple Take Profit Types
✅ Trailing Stop Option
✅ Time Filter for Backtesting
✅ Real-time Info Panel
✅ Customizable Alerts
══════════════════════════════════════════════════════════════════════════
🔹 HOW IT WORKS
The strategy uses a smoothed MACD system to detect trend changes:
- MACD Line (White): Fast EMA minus Slow EMA - shows raw momentum
- Signal Line (Yellow): EMA of MACD - shows smoothed trend direction
- Trend Zone: Changes when the smoothed signal line crosses zero
- Entry Signals: Generated at zone transitions
When the trend line crosses above zero → GREEN zone → BUY signal 🔺
When the trend line crosses below zero → RED zone → SELL signal 🔻
══════════════════════════════════════════════════════════════════════════
🔹 STOP LOSS OPTIONS
🛑 Percentage: Fixed percentage from entry price
🛑 ATR-Based: Dynamic SL based on market volatility
🛑 Fixed Points: Set number of points/pips
🛑 Swing Low/High: Uses recent swing levels as stops
══════════════════════════════════════════════════════════════════════════
🔹 TAKE PROFIT OPTIONS
🎯 Percentage: Fixed percentage target
🎯 ATR-Based: Dynamic TP based on volatility
🎯 Fixed Points: Set number of points/pips
🎯 Risk Reward: Automatic TP based on R:R ratio (e.g., 2:1, 3:1)
══════════════════════════════════════════════════════════════════════════
🔹 TRAILING STOP
📈 Percentage-Based: Trail by a fixed percentage
📈 ATR-Based: Trail using ATR multiplier for dynamic adjustment
══════════════════════════════════════════════════════════════════════════
🔹 SETTINGS
MACD Parameters:
- Fast Length (default: 12)
- Slow Length (default: 26)
- Signal Length (default: 9)
- Trend Smoothing (default: 5)
Risk Management:
- Enable/Disable Stop Loss
- Enable/Disable Take Profit
- Enable/Disable Trailing Stop
- Customize all SL/TP parameters
Visual Options:
- Show/Hide Buy/Sell Triangles
- Show/Hide SL/TP Lines
- Show/Hide Labels
Time Filter:
- Set Start Date for backtest
- Set End Date for backtest
══════════════════════════════════════════════════════════════════════════
🔹 SIGNALS EXPLAINED
🟢 GREEN TRIANGLE (Below Bar):
Bullish zone detected - Consider LONG entry
🔴 RED TRIANGLE (Above Bar):
Bearish zone detected - Consider SHORT entry
🟢 GREEN BACKGROUND:
Currently in bullish trend zone
🔴 RED BACKGROUND:
Currently in bearish trend zone
══════════════════════════════════════════════════════════════════════════
🔹 INFO PANEL
The real-time info panel (top right) displays:
- Current Trend Zone status
- MACD value
- Signal Line value
- Active SL Type
- Active TP Type
══════════════════════════════════════════════════════════════════════════
🔹 ALERTS
Set up alerts for:
🔔 Buy Signals: "🐎 Mustang Algo: BUY Signal on {ticker} at {price}"
🔔 Sell Signals: "🐎 Mustang Algo: SELL Signal on {ticker} at {price}"
══════════════════════════════════════════════════════════════════════════
🔹 BEST PRACTICES
1. Use higher timeframes (1H, 4H, Daily) for more reliable signals
2. Combine with price action and support/resistance levels
3. Adjust ATR multipliers based on asset volatility
4. Use Risk Reward ratio for consistent risk management
5. Backtest on your preferred asset before live trading
══════════════════════════════════════════════════════════════════════════
🔹 RECOMMENDED TIMEFRAMES
⏱️ Scalping: 5M, 15M (more signals, more noise)
⏱️ Day Trading: 1H, 4H (balanced signals)
⏱️ Swing Trading: Daily, Weekly (fewer but stronger signals)
══════════════════════════════════════════════════════════════════════════
🔹 MARKETS
Works on all markets:
📈 Forex
📈 Crypto
📈 Stocks
📈 Indices
📈 Commodities
📈 Futures
══════════════════════════════════════════════════════════════════════════
🐎 RIDE THE TREND WITH MUSTANG ALGO!
══════════════════════════════════════════════════════════════════════════
⚠️ DISCLAIMER
This indicator/strategy is for educational and informational purposes only. It is not financial advice. Trading involves substantial risk of loss and is not suitable for all investors. Past performance is not indicative of future results. Always use proper risk management, do your own research, and consider consulting a financial advisor before making any trading decisions. Use at your own risk.
══════════════════════════════════════════════════════════════════════════
📝 VERSION HISTORY
v1.0 - Initial Release
- MACD-based trend detection
- Visual trend zones
- Multiple SL/TP options
- Full backtesting support
- Trailing stop functionality
- Time filter
- Info panel
- Alert system
══════════════════════════════════════════════════════════════════════════
💬 FEEDBACK
If you find this strategy useful, please leave a comment or suggestion!
Your feedback helps improve future updates.
🐎 Happy Trading!

Get_rich_aggressively_v5# 🚀 GET RICH AGGRESSIVELY v5 - TIER SYSTEM
### Precision Futures Scalping | NQ • ES • YM • GC • BTC
### *Leave Every Trade With Money*
---
## 📋 QUICK CHEATSHEET
```
┌─────────────────────────────────────────────────────────────────────────────┐
│ GRA v5 SIGNAL REQUIREMENTS │
├─────────────────────────────────────────────────────────────────────────────┤
│ ✓ TIER MET Points ≥ 10 (B), ≥ 50 (A), ≥ 100 (S) │
│ ✓ VOLUME ≥ 1.3x average │
│ ✓ DELTA ≥ 55% dominance (buyers OR sellers) │
│ ✓ DIRECTION Candle color = Delta direction │
│ ✓ SESSION In London (3-5AM) or NY (9:30-11:30AM) if filter ON │
├─────────────────────────────────────────────────────────────────────────────┤
│ TIER ACTIONS │
├─────────────────────────────────────────────────────────────────────────────┤
│ 🥇 S-TIER (100+ pts) │ HOLD LONGER │ Big institutional move │
│ 🥈 A-TIER (50-99 pts) │ HOLD A BIT │ Medium move, trail to BE │
│ 🥉 B-TIER (10-49 pts) │ CLOSE QUICK │ Scalp 5-10 pts, exit fast │
│ ❌ NO TIER (< 10 pts) │ NO TRADE │ Not enough conviction │
├─────────────────────────────────────────────────────────────────────────────┤
│ SESSION PRIORITY │
├─────────────────────────────────────────────────────────────────────────────┤
│ 🔵 LONDON OPEN 03:00-05:00 ET │ IB forms 03:00-04:00 │
│ 🟢 NY OPEN 09:30-11:30 ET │ IB forms 09:30-10:30 │
│ 📊 IB BREAKOUT Close beyond IB + Impulse + 1.3x Vol = HIGH CONVICTION│
├─────────────────────────────────────────────────────────────────────────────┤
│ VOLUME PROFILE ZONES │
├─────────────────────────────────────────────────────────────────────────────┤
│ 🔵 HVN (Blue BG) High volume = Support/Resistance, expect consolidation │
│ 🟡 LVN (Yellow BG) Low volume = Breakout acceleration, fast moves │
│ 🟣 POC Point of Control = Institutional fair value │
│ 🟣 VAH/VAL Value Area edges = S/R zones │
├─────────────────────────────────────────────────────────────────────────────┤
│ MARKET STATE DECODER │
├─────────────────────────────────────────────────────────────────────────────┤
│ TREND UP │ Price > EMA20 + CVD rising │ Trade WITH the trend │
│ TREND DN │ Price < EMA20 + CVD falling │ Trade WITH the trend │
│ RETRACE │ Price/CVD diverging │ Pullback, prepare for entry │
│ RANGE │ No clear direction │ Reduce size or skip │
├─────────────────────────────────────────────────────────────────────────────┤
│ 💎 HIGH CONVICTION UPGRADE │
├─────────────────────────────────────────────────────────────────────────────┤
│ Purple diamond (◆) appears when: │
│ • Strong delta (≥65%) + Strong volume (≥2x) + Market in imbalance │
│ → Consider upgrading tier (B→A, A→S) for position sizing │
└─────────────────────────────────────────────────────────────────────────────┘
```
---
## 🎯 THE TIER SYSTEM
The tier system classifies candles by **point movement** to determine trade management:
| Tier | Points | Action | Expected R:R |
|:----:|:------:|:------:|:------------:|
| 🥇 **S-TIER** | 100+ | HOLD LONGER | 2:1+ |
| 🥈 **A-TIER** | 50-99 | HOLD A BIT | 1.5:1 |
| 🥉 **B-TIER** | 10-49 | CLOSE QUICK | 1:1 |
| ❌ **NO TIER** | < 10 | NO TRADE | — |
---
## ✅ SIGNAL REQUIREMENTS
**ALL conditions must be TRUE for a signal:**
```
SIGNAL = TIER + VOLUME + DELTA + DIRECTION + SESSION
☐ Points ≥ 10 (minimum B-tier)
☐ Volume ≥ 1.3x average
☐ Delta dominance ≥ 55%
☐ Candle direction = Delta direction
☐ In session (if filter ON)
ANY FALSE = NO SIGNAL = NO TRADE
```
---
## 📊 VOLUME DOMINANCE ANALYSIS
This is the **core edge** of GRA v5. We use intrabar analysis to determine who is in control:
```
VOLUME ANALYSIS BREAKDOWN
Total Volume = Buy Volume + Sell Volume
Buy Volume: Who pushed price UP within the bar
Sell Volume: Who pushed price DOWN within the bar
Delta = Buy Volume - Sell Volume
Buy Dominance = Buy Volume / Total Volume
Sell Dominance = Sell Volume / Total Volume
≥ 55% = ONE SIDE IN CONTROL
≥ 65% = STRONG DOMINANCE (high conviction)
```
**Direction Confirmation Matrix:**
| Candle | Delta | Signal |
|:-------|:------|:-------|
| 🟢 Bullish | 55%+ Buyers | ✅ LONG |
| 🟢 Bullish | 55%+ Sellers | ❌ Trap |
| 🔴 Bearish | 55%+ Sellers | ✅ SHORT |
| 🔴 Bearish | 55%+ Buyers | ❌ Trap |
---
## 🕐 SESSION CONTEXT
### Initial Balance (IB) Framework
The **first hour** of each session establishes the IB range. Institutions use this for the day's framework.
```
SESSION WINDOWS (Eastern Time):
LONDON:
├── IB Period: 03:00 - 04:00 ← Range established
├── Trade Window: 03:00 - 05:00 ← Best signals
└── Extension Targets: 1.5x, 2.0x
NY:
├── IB Period: 09:30 - 10:30 ← Range established
├── Trade Window: 09:30 - 11:30 ← Best signals
└── Extension Targets: 1.5x, 2.0x
```
### IB Breakout Signals
```
L▲ / L▼ = London IB Breakout (Blue)
N▲ / N▼ = NY IB Breakout (Orange)
Confirmation Required:
☐ Close beyond IB level (not just wick)
☐ Impulse candle (body > 60% of range)
☐ Volume > 1.3x average
```
**IB Statistics:**
- 97% of days break either IB high or low
- 1.5x extension = first profit target
- 2.0x extension = full range target
- ~66% of London sessions sweep Asian high/low first
---
## 📈 VIRTUAL VOLUME PROFILE ZONES
GRA v5 calculates volume profile zones **without drawing the profile**, giving you the key levels:
### Zone Types
| Zone | Background | Meaning | Action |
|:-----|:-----------|:--------|:-------|
| **HVN** | 🔵 Blue | High Volume Node | S/R zone, expect consolidation |
| **LVN** | 🟡 Yellow | Low Volume Node | Breakout zone, fast acceleration |
| **POC** | 🟣 Purple dots | Point of Control | Institutional fair value |
| **VAH/VAL** | 🟣 Purple lines | Value Area edges | S/R boundaries |
### How to Use
```
ENTERING A TRADE:
At HVN:
├── Expect price to consolidate
├── Look for rejection/absorption
└── Better for reversals
At LVN:
├── Expect fast price movement
├── Don't fight the direction
└── Better for breakouts
Near POC:
├── Institutional fair value
├── Strong magnet effect
└── Watch for volume at POC
```
---
## 🔄 MARKET STATE DETECTION
GRA v5 classifies the market into four states using **CVD + Price Action**:
```
CVD Direction
↑ Rising ↓ Falling
┌─────────────┬─────────────┐
Price > EMA20 │ TREND UP │ RETRACE │
│ (Go Long) │ (Pullback) │
├─────────────┼─────────────┤
Price < EMA20 │ RETRACE │ TREND DN │
│ (Pullback) │ (Go Short) │
└─────────────┴─────────────┘
```
| State | Meaning | Action |
|:------|:--------|:-------|
| **TREND UP** | Buyers in control | Trade long, follow signals |
| **TREND DN** | Sellers in control | Trade short, follow signals |
| **RETRACE** | Pullback against trend | Prepare for continuation entry |
| **RANGE** | No clear direction | Reduce size or wait |
---
## 💎 HIGH CONVICTION UPGRADES
When extra conditions align, GRA v5 marks the signal with a **purple diamond**:
```
HIGH CONVICTION = Base Signal + Strong Delta (65%+) + Strong Volume (2x+) + Imbalance State
```
**Action:** Consider upgrading tier for position sizing:
- B-Tier → A-Tier management
- A-Tier → S-Tier management
---
## 📋 TRADING BY TIER
### 🥇 S-TIER (100+ points)
| | |
|:--|:--|
| **Entry** | Candle close |
| **Target** | IB extension / Next S/R |
| **Management** | HOLD LONGER |
**Rules:**
- Watch next candle - continues? HOLD
- Same tier same direction? ADD
- Opposite tier signal? EXIT on close
- Never close early unless reversal signal
### 🥈 A-TIER (50-99 points)
| | |
|:--|:--|
| **Entry** | Candle close |
| **Target** | 1.5x initial risk minimum |
| **Management** | HOLD A BIT |
**Rules:**
- Target 1.5:1 R:R minimum
- Trail to breakeven after 1:1
- If stalls, take profit
- Upgrade to S-tier management if high conviction
### 🥉 B-TIER (10-49 points)
| | |
|:--|:--|
| **Entry** | Candle close |
| **Target** | 5-10 points MAX |
| **Management** | CLOSE QUICK |
**Rules:**
- Exit in 1-3 candles
- DO NOT hold for more
- Any doubt = EXIT
- Quick scalp mentality
---
## ⚙️ SETTINGS BY INSTRUMENT
| Setting | NQ/ES | YM | GC | BTC |
|:--------|:-----:|:--:|:--:|:---:|
| **Timeframe** | 1-5 min | 1-5 min | 5-15 min | 1-15 min |
| **S-Tier** | 100 pts | 100 pts | 15 pts | 500 pts |
| **A-Tier** | 50 pts | 50 pts | 8 pts | 250 pts |
| **B-Tier** | 10 pts | 15 pts | 3 pts | 50 pts |
| **Min Volume** | 1.3x | 1.3x | 1.5x | 1.3x |
| **Delta %** | 55% | 55% | 58% | 55% |
| **Best Time** | 9:30-11:30 ET | 9:30-11:30 ET | 3-5AM & 8:30-10:30 ET | 24/7 |
---
## 📊 TABLE LEGEND
The info panel displays real-time market data:
| Row | Shows | Colors |
|:----|:------|:-------|
| **Pts** | Candle points | Gold/Green/Yellow by tier |
| **Tier** | S/A/B/X | Gold/Green/Yellow/White |
| **Vol** | Volume ratio | Yellow (2x+) / Green (1.3x+) / Red |
| **Delta** | Buy/Sell % | Green (buy) / Red (sell) / White |
| **CVD** | Direction | Green ▲ / Red ▼ |
| **State** | Market state | Green/Red/Orange/Gray |
| **Sess** | Session | Yellow if active |
| **Zone** | VP zone | Blue/Yellow/Purple |
| **Sig** | Signal | Green/Red if active |
---
## 🔔 ALERTS
| Alert | When | Action |
|:------|:-----|:-------|
| **S-TIER LONG/SHORT** | S-tier signal | Hold longer |
| **A-TIER LONG/SHORT** | A-tier signal | Hold a bit |
| **B-TIER LONG/SHORT** | B-tier signal | Close quick |
| **LON IB BREAK UP/DN** | London IB breakout | Major session move |
| **NY IB BREAK UP/DN** | NY IB breakout | Major session move |
| **HIGH CONVICTION** | Upgraded signal | Consider larger size |
| **LONDON/NY OPEN** | Session start | Get ready |
---
## 💰 THE GOLDEN RULE
> ### **LEAVE EVERY TRADE WITH MONEY**
>
> | Situation | Rule |
> |:----------|:-----|
> | B-Tier | Small win > Small loss |
> | A-Tier | Trail to BE, lock profit |
> | S-Tier | Let it run to target |
> | No Signal | NO TRADE |
> | Wrong Side | EXIT immediately |
>
> **Capital preserved = Trade tomorrow**
---
## ⚠️ DISCLAIMER
> Risk management is **YOUR** responsibility.
> Never risk more than 1-2% per trade.
> Paper trade until you understand the signals.
> Past performance ≠ future results.
---
### Get Rich. Stay Rich. Trade Aggressively. 🚀
**Get Rich Aggressively v5**
*Precision Futures Scalping*

RSI Strategy [PrimeAutomation]⯁ OVERVIEW
The RSI Strategy is a momentum-driven trading system built around the behavior of the Relative Strength Index (RSI).
Instead of using traditional overbought/oversold zones, this strategy focuses on RSI breakouts with volatility-based trailing stops, adaptive profit-targets, and optional early-exit logic.
It is designed to capture strong continuation moves after momentum shifts while protecting trades using ATR-based dynamic risk management.
⯁ CONCEPTS
RSI Breakout Momentum: Entries happen when RSI breaks above/below custom thresholds, signaling a shift in momentum rather than mean reversion.
Volatility-Adjusted Risk: ATR defines both stop-loss and profit-target distances, scaling positions based on market volatility.
Dynamic Trailing Stop: The strategy maintains an adaptive trailing level that tightens as price moves in the trade’s favor.
Single-Position System: Only one trade at a time (no pyramiding), maximizing clarity and simplifying execution.
⯁ KEY FEATURES
RSI Signal Engine
• Long when RSI crosses above Upper threshold
• Short when RSI crosses below Lower threshold
These levels are configurable and optimized for trend-momentum detection.
ATR-Based Stop-Loss
A custom ATR multiplier defines the initial stop.
• Long stop = price – ATR × multiplier
• Short stop = price + ATR × multiplier
Stops adjust continuously using a trailing model.
ATR-Based Take Profit (Optional)
Profit targets scale with volatility.
• Long TP = entry + ATR × TP-multiplier
• Short TP = entry – ATR × TP-multiplier
Users can disable TP and rely solely on trailing stops.
Real-Time Trailing Logic
The stop updates bar-by-bar:
• In a long trade → stop moves upward only
• In a short trade → stop moves downward only
This keeps the stop tight as trends develop.
Early Exit Module (Optional)
After X bars in a trade, opposite RSI signals trigger exit.
This reduces holding time during weak follow-through phases.
Full Visual Layer
• RSI plotted with threshold fills
• Entry/TP/Stop visual lines
• Color-coded zones for clarity
⯁ HOW TO USE
Look for RSI Breakouts:
Focus on RSI crossing above the upper boundary (long) or below the lower boundary (short). These moments identify fresh momentum surges.
Use ATR Levels to Manage Risk:
Because stops and targets scale with volatility, the strategy adapts well to both quiet and explosive market phases.
Monitor Trailing Stops for Trend Continuation:
The trailing stop is the primary driver of exits—often outperforming fixed targets by catching larger runs.
Use on Liquid Markets & Mid-Higher Timeframes:
The system performs best where RSI and ATR signals are clean—crypto majors, FX, and indices.
⯁ CONCLUSION
The RSI Strategy is a modern RSI breakout system enhanced with volatility-adaptive risk management and flexible exit logic. It is designed for traders who prefer momentum confirmation over mean reversion, offering a disciplined framework with robust protections and dynamic trend-following capability.
Its blend of ATR-based stops, optional profit targets, and RSI-driven entries makes it a reliable strategy across a wide range of market conditions.

Global Macro IndexGlobal Macro Index
The Global Macro Index is a comprehensive economic sentiment indicator that aggregates 23 real-time macroeconomic data points from the world's largest economies (US, EU, China, Japan, Taiwan). It provides a single normalized score that reflects the overall health and momentum of the global economy, helping traders identify macro trends that drive asset prices.
⚠️ Important: Timeframe Settings
This indicator is designed exclusively for the 1W (weekly) timeframe. The indicator is hardcoded to pull weekly data and will not function correctly on other timeframes.
What It Measures
The indicator tracks normalized Trend Power Index (TPI) values across multiple economic categories:
United States (7 components)
Business Confidence Index (BCOI) - Business sentiment and outlook
Composite Leading Indicator (CLI) - Forward-looking economic indicators
Consumer Confidence Index (CCI) - Consumer sentiment and spending intentions
Terms of Trade (TOT) - Import/export price relationships
Manufacturing Composite - Combines business confidence, production, and new orders
Comprehensive Economic Composite - Broad aggregation including employment, business activity, and regional indicators
Business Inventory (BI) - Stock levels and supply chain health
European Union (10 components)
Sentiment Survey (SS) - Overall economic sentiment
Business Confidence Index - EU business outlook
Economic Sentiment Indicator (ESI) - Combined confidence metrics
Manufacturing Production (MPRYY) - Industrial output year-over-year
New Orders - Germany, France, Netherlands, Spain manufacturing orders
Composite Leading Indicators - Germany, France forward-looking metrics
Business Climate Index (BCLI) - France business conditions
Asia (6 components)
New Orders - China, Japan, Taiwan manufacturing demand
Composite Leading Indicators - China, Japan economic momentum
The Formula
The indicator calculates a weighted average of normalized TPI scores:
Global Macro Index = (1/23) × Σ
Each of the 23 economic indicators is:
Converted to a Trend Power Index (TPI) using 4-day Bitcoin normalization
Weighted equally (1/23 ≈ 4.35% each)
Summed and smoothed with a 1-period SMA
The result is a single oscillator that ranges typically between -1 and +1, with extreme readings beyond ±0.6.
Z-Score Signal System
The indicator includes an optional Z-Score overlay that identifies extreme macro conditions:
Calculation:
Z-Score = (Current Value - 50-period Mean) / Standard Deviation
Smoothed with 35-period Hull Moving Average
Inverted for intuitive interpretation
Signals:
Green background (Z-Score ≥ 2) = Extremely positive macro conditions, potential overbought
Red background (Z-Score ≤ -2) = Extremely negative macro conditions, potential oversold
These extreme readings occur approximately 5% of the time statistically
How to Use It
Interpreting the Main Plot (Red Line):
Above 0 = Positive macro momentum, risk-on environment
Below 0 = Negative macro momentum, risk-off environment
Above +0.6 = Strong expansion, bullish for equities and crypto
Below -0.6 = Severe contraction, bearish conditions
Trend direction = More important than absolute level
Z-Score Signals:
Z ≥ 2 (Green) = Macro sentiment extremely positive, consider taking profits or preparing for pullback
Z ≤ -2 (Red) = Macro sentiment extremely negative, potential buying opportunity for contrarians
Works best as a regime filter, not precise timing tool
Best Practices:
Use as a macro regime filter for other strategies
Combines well with liquidity indicators and price action
Leading indicator for risk assets (equities, Bitcoin, emerging markets)
Lagging indicator - confirms macro trends rather than predicting reversals
Watch for divergences: price making new highs while macro weakens (bearish) or vice versa (bullish)
Settings
Show Zscore Signals: Toggle green/red background shading for extreme readings
Overlay Zscore Signals: Display Z-Score signals on the price chart as well as the indicator panel
Reference Lines
0 (gray) = Neutral macro conditions
+0.6 (green) = Strong positive threshold
-0.6 (red) = Strong negative threshold
Data Sources
Real-time economic data from TradingView's ECONOMICS database, including:
OECD leading indicators
Manufacturing PMIs and new orders
Consumer and business confidence surveys
Trade and inventory metrics
Regional economic sentiment indices
Notes
This is a macro trend indicator, not a day-trading tool. Economic data updates weekly and reflects the aggregate health of global growth. Best used on weekly timeframes to identify favorable or unfavorable macro regimes for risk asset allocation.
The indicator distills complex global economic data into a single actionable score, answering: "Is the global economy expanding or contracting right now?"

bows//@version=5
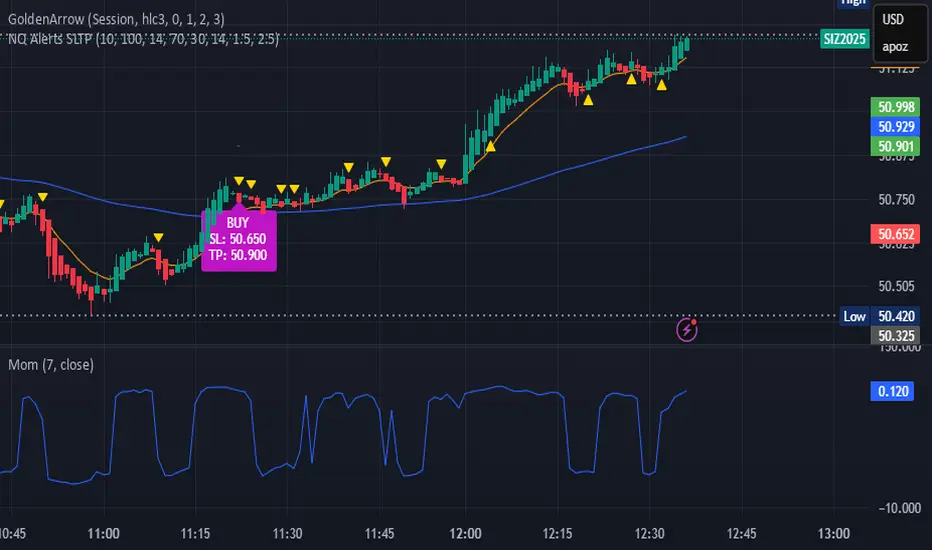
indicator("NQ EMA+RSI+ATR Alerts with SL/TP", overlay=true, shorttitle="NQ Alerts SLTP")
// === Inputs ===a
fastLen = input.int(9, "Fast EMA", minval=1)
slowLen = input.int(21, "Slow EMA", minval=1)
rsiLen = input.int(14, "RSI Length", minval=1)
rsiLongMax = input.int(70, "Max RSI to allow LONG", minval=50, maxval=90)
rsiShortMin = input.int(30, "Min RSI to allow SHORT", minval=10, maxval=50)
atrLen = input.int(14, "ATR Length", minval=1)
atrMultSL = input.float(1.5, "ATR Stop-Loss Multiplier", step=0.1)
atrMultTP = input.float(2.5, "ATR Take-Profit Multiplier", step=0.1)
// === Indicator calculations ===
price = close
fastEMA = ta.ema(price, fastLen)
slowEMA = ta.ema(price, slowLen)
rsiVal = ta.rsi(price, rsiLen)
atr = ta.atr(atrLen)
// === Entry signals ===
longSignal = ta.crossover(fastEMA, slowEMA) and rsiVal < rsiLongMax
shortSignal = ta.crossunder(fastEMA, slowEMA) and rsiVal > rsiShortMin
// === SL/TP Levels ===
longSL = price - atr * atrMultSL
longTP = price + atr * atrMultTP
shortSL = price + atr * atrMultSL
shortTP = price - atr * atrMultTP
// === Plotting ===
plot(fastEMA, color=color.orange, title="Fast EMA")
plot(slowEMA, color=color.blue, title="Slow EMA")
plotshape(longSignal, title="Buy Signal", style=shape.triangleup, color=color.new(color.green, 0), location=location.belowbar, size=size.tiny)
plotshape(shortSignal, title="Sell Signal", style=shape.triangledown, color=color.new(color.red, 0), location=location.abovebar, size=size.tiny)
// Optional visualization of SL/TP
plot(longSignal ? longSL : na, "Long Stop-Loss", color=color.new(color.red, 50), style=plot.style_linebr)
plot(longSignal ? longTP : na, "Long Take-Profit", color=color.new(color.green, 50), style=plot.style_linebr)
plot(shortSignal ? shortSL : na, "Short Stop-Loss", color=color.new(color.red, 50), style=plot.style_linebr)
plot(shortSignal ? shortTP : na, "Short Take-Profit", color=color.new(color.green, 50), style=plot.style_linebr)
// === Alerts with SL/TP info ===
alertcondition(longSignal, title="BUY Signal",
message="BUY Alert — NQ LONG: Entry @ {{close}} | SL: {{plot_1}} | TP: {{plot_2}} | {{ticker}}")
alertcondition(shortSignal, title="SELL Signal",
message="SELL Alert — NQ SHORT: Entry @ {{close}} | SL: {{plot_3}} | TP: {{plot_4}} | {{ticker}}")
// === Visual labels ===
if (longSignal)
label.new(bar_index, low, "BUY\nSL: " + str.tostring(longSL, format.mintick) + "\nTP: " + str.tostring(longTP, format.mintick),
style=label.style_label_up, color=color.new(#be14c4, 0), textcolor=color.white)
if (shortSignal)
label.new(bar_index, high, "SELL\nSL: " + str.tostring(shortSL, format.mintick) + "\nTP: " + str.tostring(shortTP, format.mintick),
style=label.style_label_down, color=color.new(color.red, 0), textcolor=color.white)
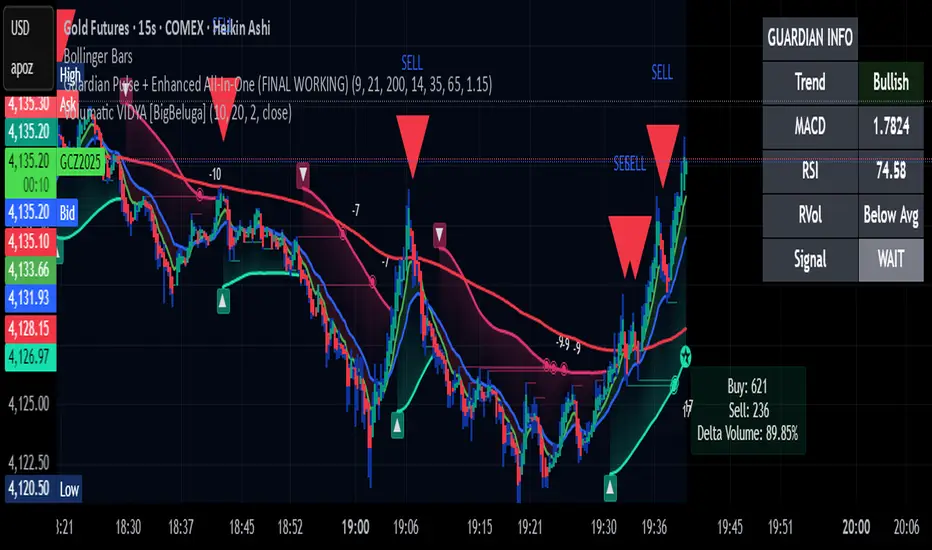
Guardian Pulse + Enhanced All-In-One (FINAL WORKING)GUARDIAN BUY SIGNAL (Lime Candle + Big Green Arrow)
All 4 must happen on the same candle:
RSI (14) crosses above 35 from below (bouncing out of oversold)
Price is above the blue 21 EMA (short-term trend filter)
Candle closes green (close > open)
Volume is at least 15% above its 20-period average (real buying pressure)
→ When all four line up = lime candle + huge green “BUY” arrow
→ That’s your master entry. Buy shares, calls, whatever.
GUARDIAN SELL / EXIT SIGNAL (Red Down Arrow)
RSI (14) crosses below 65 from above
→ That’s your “take profits or get out” signal (red down-triangle appears above the bar)
Optional Trend Filter (for safety)
Only take BUY signals when the overall trend is Bullish (9 EMA > 21 EMA > 200 EMA)
The info box in the top-right will say “Bullish” in green when it’s safe.
BifaneiroSinaleiro V3 ULTIMATEBifaneiroSinaleiro V3 ULTIMATE - Complete ICT Analysis System & Signal Generator
This isn't just an indicator - it's your 24/7 ICT analyst that does the manual work for you.
━━━━━━━━━━━━━━━━━━━━━━━━━━━━━━━━━━━━━━
🔥 WHAT IT DOES FOR YOU:
━━━━━━━━━━━━━━━━━━━━━━━━━━━━━━━━━━━━━━
✅ Marks ALL ICT Concepts Automatically:
- Fair Value Gaps (LTF + HTF with priority)
- Market Structure (BOS/CHoCH in real-time)
- Breaker Blocks (validated with volume + killzone)
- Liquidity Sweeps (Asian High/Low runs)
- Premium/Discount Arrays + OTE Zones
- Institutional Sessions (London, NY Silver Bullets)
✅ Advanced Pattern Recognition:
- Turtle Soup (sweep + reversal)
- Unicorn Model (sweep → BOS → FVG)
- SMT Divergences (monitors correlated pairs)
- PO3/AMD Phases (Accumulation → Manipulation → Distribution)
✅ Intelligent Scoring System:
- 12+ confluence factors analyzed
- Minimum score 12 for signals (configurable)
- Score 20+ = EXTREME (enables 2nd trade in session)
- Visual score display on every signal
✅ Professional Trade Management:
- 1 trade per session (London, NY AM, NY PM) = max 3/day
- EXTREME mode: 2 trades per session = max 6/day
- Automatic stop loss (session range-based)
- Dynamic take profit (score-adjusted multiplier)
- Auto breakeven after 2.5x move
- EOD close (23:59) with P&L label
- Weekend close (Fri 23:55) with P&L label
✅ 100% ICT Pure Methodology:
- NO EMAs, NO ATR, NO lagging indicators
- Pure price action: High/Low/Range only
- HTF confirmation via Premium/Discount (not EMAs!)
- Stop loss via Asian Range (not ATR!)
━━━━━━━━━━━━━━━━━━━━━━━━━━━━━━━━━━━━━━
⚡ WHY IT'S DIFFERENT:
━━━━━━━━━━━━━━━━━━━━━━━━━━━━━━━━━━━━━━
Traditional indicators show 1-2 concepts. This shows 10+ simultaneously.
Manual ICT takes 2-3 hours per session. This does it in milliseconds.
Other systems guess. This scores with objective confluence.
You save hours daily. You trade better. You profit more consistently.
━━━━━━━━━━━━━━━━━━━━━━━━━━━━━━━━━━━━━━
📊 WHAT YOU GET:
━━━━━━━━━━━━━━━━━━━━━━━━━━━━━━━━━━━━━━
- Real-time dashboard (scores, confluences, structure)
- Precision signals (only in killzones, only with confluences)
- Trade tracking (win rate, RR, P&L by session)
- Multi-timeframe analysis (automatic)
- News block filter (configurable)
- Full customization (colors, thresholds, sessions)
- Comprehensive alerts (8+ types)
Works on: Forex, Indices, Commodities, Crypto
Best on: 1m-5m for execution, 15m+ for swing
Timezone: Configured for CET (UTC+1), easily adjustable
⚠️ This is a professional tool requiring ICT/SMC understanding.
Not magic - it's methodology, automated.
🚀 Stop drawing. Start trading. Add to chart now.

Super momentum DBSISuper momentum DBSI: The Ultimate Guide
1. What is this Indicator?
The Super momentum DBSI is a "Consensus Engine." Instead of relying on a single line (like an RSI) to tell you where the market is going, this tool calculates 33 distinct technical indicators simultaneously for every single candle.
It treats the market like a democracy. It asks 33 mathematical "voters" (Momentum, Trend, Volume, Volatility) if they are Bullish or Bearish.
If 30 out of 33 say "Buy," the score is high (Yellow), and the trend is extremely strong.
If only 15 say "Buy," the score is low (Teal), and the trend is weak or choppy.
2. Visual Guide: How to Read the Numbers
The Scores
Top Number (Bears): Represents Selling Pressure.
Bottom Number (Bulls): Represents Buying Pressure.
The Colors (The Traffic Lights)
The colors are your primary signal. They tell you who is currently winning the war.
🟡 YELLOW (Dominance):
This indicates the Winning Side.
If the Bottom Number is Yellow, Bulls are in control.
If the Top Number is Yellow, Bears are in control.
🔴 RED (Weakness):
This appears on the Top. It means Bears are present but losing.
🔵 TEAL (Weakness):
This appears on the Bottom. It means Bulls are present but losing.
3. Trading Strategy
Scenario A: The "Strong Buy" (Long Entry)
The Setup: You are looking for a shift in momentum where Buyers overwhelm Sellers.
Watch the Bottom Number: Wait for it to turn Yellow.
Confirm Strength: Ensure the score is above 15 and rising (e.g., 12 → 18 → 22).
Check the Top: The Top Number should be Red and low (below 10).
Trigger: Enter on the candle close.
Scenario B: The "Strong Sell" (Short Entry)
The Setup: You are looking for Sellers to crush the Buyers.
Watch the Top Number: Wait for it to turn Yellow.
Confirm Strength: Ensure the score is above 15 and rising.
Check the Bottom: The Bottom Number should be Teal and low.
Trigger: Enter on the candle close.
Scenario C: The "No Trade Zone" (Choppy Market)
The Setup: The market is confused.
Visual: Top is Red, Bottom is Teal.
Meaning: NOBODY IS WINNING. There is no Yellow number.
Action: Do not trade. This usually happens during lunch hours, weekends, or right before big news. This filter alone will save you from many false breakouts.
4. What is Inside? (The 33 Indicators)
To give you confidence in the signals, here is exactly what the script is checking:
Group 1: Momentum (Oscillators)
Detects if price is moving fast.
RSI (Relative Strength Index)
CCI (Commodity Channel Index)
Stochastic
Williams %R
Momentum
Rate of Change (ROC)
Ultimate Oscillator
Awesome Oscillator
True Strength Index (TSI)
Stoch RSI
TRIX
Chande Momentum Oscillator
Group 2: Trend Direction
Detects the general path of the market.
13. MACD
14. Parabolic SAR
15. SuperTrend
16. ALMA (Moving Average)
17. Aroon
18. ADX (Directional Movement)
19. Coppock Curve
20. Ichimoku Conversion Line
21. Hull Moving Average
Group 3: Price Action
Detects where price is relative to averages.
22. Price vs EMA 20
23. Price vs EMA 50
24. Price vs EMA 200
Group 4: Volume & Force
Detects if there is money behind the move.
25. Money Flow Index (MFI)
26. On Balance Volume (OBV)
27. Chaikin Money Flow (CMF)
28. VWAP (Intraday)
29. Elder Force Index
30. Ease of Movement
Group 5: Volatility
Detects if price is pushing the outer limits.
31. Bollinger Bands
32. Keltner Channels
33. Donchian Channels
5. Pro Tips for Success
Don't Catch Knives: If the Bear score (Top) is Yellow and 25+, do not try to buy the dip. Wait for the Yellow score to break.
Exit Early: If you are Long and the Yellow Bull score drops from 28 to 15 in one candle, TAKE PROFIT. The momentum has died.
Use Higher Timeframes: This indicator works best on 15m, 1H, and 4H charts. On the 1m chart, it may be too volatile.

MTF Scalper - alemicihanMulti-Timeframe Scalper Strategy: Aligning the Big Picture for Quick Gains
This article presents a robust futures trading strategy designed for high-frequency scalping in the crypto market. It’s built on the principle of minimizing risk by ensuring that short-term entries are always aligned with the dominant, higher-timeframe trend.
The Core Concept: Alignment is Key
A Balanced Trend Follower approach, now refined for rapid scalping, uses a Multi-Timeframe (MTF) confirmation system to filter out market noise and increase the probability of a successful trade.
The strategy operates on a Low Timeframe (LTF) chart (e.g., 3m, 5m, or 15m) but only executes trades if the direction is validated by three Higher Timeframes (HTF).
ComponentPurposeFunctionHTF (D, 4h, 1h) EMA => Trend Confirmation =>Checks if the current price is above/below all three Exponential Moving Averages (EMA 20). This provides a strong directional bias.
LTF (5m) Stochastic RSI => Momentum Entry => Generates the actual buy/sell signal by spotting a swift crossover, indicating fresh momentum in the direction of the confirmed HTF trend.
How The Signal Is Generated
Trend Alignment: The system first confirms the trend. If the price is trading above the Daily, 4-Hour, and 1-Hour EMAs, the market is deemed to be in a Strong LONG Trend. Only LONG signals are permitted.
Momentum Trigger: Once the trend is confirmed, a Long Signal is generated only when the Stochastic K-Line crosses above the D-Line, indicating a momentum shift (a pullback ending) towards the main trend direction.
Short Signal: The inverse logic applies to the Short Trend confirmation and entry signal.
Mandatory Risk Management: ATR-Based Exit
Given the high leverage nature of futures and scalping, static Stop-Loss (SL) and Take-Profit (TP) levels are inefficient. This strategy uses the Average True Range (ATR) indicator to dynamically set profit and loss targets based on current market volatility.
Stop Loss (SL): Set dynamically at 1.5 x ATR below (for long) or above (for short) the entry price. This gives the trade enough room to breathe without risking excessive capital.
Take Profit (TP): Set dynamically at 3.0 x ATR, establishing a robust Risk-to-Reward Ratio of 1:2.
Final Thoughts on Testing
This sophisticated approach combines the reliability of MTF analysis with the speed of momentum indicators. However, data analysis is key. Backtesting these parameters (EMA, ATR Multipliers, RSI/Stochastic lengths) on your chosen asset (like BTC/USDT or ETH/USDT) and timeframe is crucial to achieving optimal performance.

15m ORB + FVG Strategy (ChadAnt)Core Logic
The indicator's logic revolves around three main phases:
1. Defining the 15-Minute Opening Range (ORB)
The script calculates the highest high (rangeHigh) and lowest low (rangeLow) that occurred during the first 15 minutes of the trading day.
This time window is defined by the sessionStr input, which defaults to 0930-0945 (exchange time).
The high and low of this range are plotted as small gray dots once the session ends (rangeSet = true).
2. Identifying a Fair Value Gap (FVG) Setup
After the 15-minute range is set, the indicator waits for a breakout of either the range high or range low.
A "Strict FVG breakout" requires two conditions on the first candle that closes beyond the range:
The candle before the breakout candle ( bars ago) must have been inside the range.
The breakout candle ( bar ago) must have closed outside the range.
A Fair Value Gap (FVG) must form on the most recent three candles (the current bar and the two previous bars).
Bullish FVG (Long Setup): The low of the current bar (low) is greater than the high of the bar two periods prior (high ). This FVG represents a price inefficiency that the trade expects to fill.
Bearish FVG (Short Setup): The high of the current bar (high) is less than the low of the bar two periods prior (low ).
If a valid FVG setup occurs, the indicator marks a pending setup and draws a colored box to highlight the FVG area (Green for Bullish FVG, Red for Bearish FVG).
3. Trade Entry and Management
If a pending setup is identified, the trade is structured as a re-entry trade into the FVG zone:
Entry Price: Set at the outer boundary of the FVG, which is the low of the current bar for a Long setup, or the high of the current bar for a Short setup.
Stop Loss (SL): Set at the opposite boundary of the FVG, which is the low for a Long setup, or the high for a Short setup.
The trade is triggered (tradeActive = true) once the price retraces to the pendingEntry level.
Risk/Reward (RR) Targets: Three Take Profit (TP) levels are calculated based on the distance between the Entry and Stop Loss:
$$\text{Risk} = | \text{Entry} - \text{SL} |$$
$$\text{TP}n = \text{Entry} \pm (\text{Risk} \times \text{RR}n)$$
where $n$ is 1, 2, or 3, corresponding to the input $\text{RR}1$, $\text{RR}2$, and $\text{RR}3$ values (defaults: 1.0, 1.5, and 2.0).
Trade Lines: Upon triggering, lines for the Entry, Stop Loss, and three Take Profit levels are drawn on the chart for a specified length (lineLength).
A crucial feature is the directional lock (highBroken / lowBroken):
If the price breaks a range level (e.g., simpleBrokeHigh) but without a valid FVG setup, the corresponding directional flag (e.g., highBroken) is set to true permanently for the day.
This prevents the indicator from looking for any subsequent trade setups in that direction for the rest of the day, suggesting that the initial move, without an FVG, exhausted the opportunity.
Open-source script
In true TradingView spirit, the creator of this script has made it open-source, so that traders can review and verify its functionality. Kudos to the author! While you can use it for free, remember that republishing the code is subject to our House Rules.
ChadAnt
Disclaimer
The information and publications are not meant to be, and do not constitute, financial, investment, trading, or other types of advice or recommendations supplied

15m ORB + FVG (ChadAnt)Core Logic
The indicator's logic revolves around three main phases:
1. Defining the 15-Minute Opening Range (ORB)
The script calculates the highest high (rangeHigh) and lowest low (rangeLow) that occurred during the first 15 minutes of the trading day.
This time window is defined by the sessionStr input, which defaults to 0930-0945 (exchange time).
The high and low of this range are plotted as small gray dots once the session ends (rangeSet = true).
2. Identifying a Fair Value Gap (FVG) Setup
After the 15-minute range is set, the indicator waits for a breakout of either the range high or range low.
A "Strict FVG breakout" requires two conditions on the first candle that closes beyond the range:
The candle before the breakout candle ( bars ago) must have been inside the range.
The breakout candle ( bar ago) must have closed outside the range.
A Fair Value Gap (FVG) must form on the most recent three candles (the current bar and the two previous bars).
Bullish FVG (Long Setup): The low of the current bar (low) is greater than the high of the bar two periods prior (high ). This FVG represents a price inefficiency that the trade expects to fill.
Bearish FVG (Short Setup): The high of the current bar (high) is less than the low of the bar two periods prior (low ).
If a valid FVG setup occurs, the indicator marks a pending setup and draws a colored box to highlight the FVG area (Green for Bullish FVG, Red for Bearish FVG).
3. Trade Entry and Management
If a pending setup is identified, the trade is structured as a re-entry trade into the FVG zone:
Entry Price: Set at the outer boundary of the FVG, which is the low of the current bar for a Long setup, or the high of the current bar for a Short setup.
Stop Loss (SL): Set at the opposite boundary of the FVG, which is the low for a Long setup, or the high for a Short setup.
The trade is triggered (tradeActive = true) once the price retraces to the pendingEntry level.
Risk/Reward (RR) Targets: Three Take Profit (TP) levels are calculated based on the distance between the Entry and Stop Loss:
$$\text{Risk} = | \text{Entry} - \text{SL} |$$
$$\text{TP}n = \text{Entry} \pm (\text{Risk} \times \text{RR}n)$$
where $n$ is 1, 2, or 3, corresponding to the input $\text{RR}1$, $\text{RR}2$, and $\text{RR}3$ values (defaults: 1.0, 1.5, and 2.0).
Trade Lines: Upon triggering, lines for the Entry, Stop Loss, and three Take Profit levels are drawn on the chart for a specified length (lineLength).
A crucial feature is the directional lock (highBroken / lowBroken):
If the price breaks a range level (e.g., simpleBrokeHigh) but without a valid FVG setup, the corresponding directional flag (e.g., highBroken) is set to true permanently for the day.
This prevents the indicator from looking for any subsequent trade setups in that direction for the rest of the day, suggesting that the initial move, without an FVG, exhausted the opportunity.

Scout Regiment - OBV# Scout Regiment - OBV Indicator
## English Documentation
### Overview
Scout Regiment - OBV (On-Balance Volume) is an advanced momentum indicator that combines volume and price movement to identify the strength of buying and selling pressure. This indicator features an oscillator-based approach with divergence detection to help traders spot potential trend reversals and confirm price movements.
### What is OBV?
On-Balance Volume (OBV) is a cumulative volume indicator that adds volume on up days and subtracts volume on down days:
- **Rising OBV**: Accumulation (buying pressure)
- **Falling OBV**: Distribution (selling pressure)
- **OBV Oscillator**: The difference between OBV and its smoothed moving average, making divergences easier to spot
### Key Features
#### 1. **OBV Oscillator Display**
Instead of displaying raw OBV values, this indicator shows the oscillator (difference between OBV and its smoothed line):
**Benefits:**
- Easier to identify divergences
- Clearer trend changes
- More sensitive to momentum shifts
- Zero line as reference point
**Visual Elements:**
- **Step Line**: Main OBV oscillator line
- Green: Positive oscillator (accumulation)
- Red: Negative oscillator (distribution)
- **Histogram**: Visual representation of oscillator strength
- Green bars: Above zero line
- Red bars: Below zero line
- **Zero Line**: White dotted horizontal line as reference
#### 2. **Smoothing Options**
Choose from multiple moving average types to smooth the OBV:
- **None**: Raw OBV (most sensitive)
- **SMA**: Simple Moving Average (equal weight)
- **EMA**: Exponential Moving Average (recent price emphasis) - Default
- **SMMA (RMA)**: Smoothed Moving Average (very smooth)
- **WMA**: Weighted Moving Average (linear weight)
- **VWMA**: Volume Weighted Moving Average (volume emphasis)
**Default Settings:**
- Type: EMA
- Length: 21 periods
- Best for: Most market conditions
#### 3. **Multi-Timeframe Analysis**
- Calculate OBV on any timeframe
- View higher timeframe momentum on lower timeframe charts
- Align trades with larger timeframe volume trends
- Empty field = Current chart timeframe
#### 4. **Visual Enhancements**
**Background Color**
- Light green: Positive oscillator (bullish volume pressure)
- Light red: Negative oscillator (bearish volume pressure)
- Optional display for cleaner charts
**Crossover Labels**
- "突破" (Breakout): When oscillator crosses above zero
- "跌破" (Breakdown): When oscillator crosses below zero
- Indicates potential trend changes
- Can be toggled on/off
#### 5. **Comprehensive Divergence Detection**
The indicator automatically detects four types of divergences:
**Regular Bullish Divergence (Yellow)**
- **Price**: Makes lower lows
- **OBV**: Makes higher lows
- **Signal**: Potential upward reversal
- **Label**: "看涨" (Bullish)
- **Use**: Enter long positions
**Regular Bearish Divergence (Blue)**
- **Price**: Makes higher highs
- **OBV**: Makes lower highs
- **Signal**: Potential downward reversal
- **Label**: "看跌" (Bearish)
- **Use**: Enter short positions or exit longs
**Hidden Bullish Divergence (Light Yellow)**
- **Price**: Makes higher lows
- **OBV**: Makes lower lows
- **Signal**: Trend continuation (uptrend)
- **Label**: "隐藏看涨" (Hidden Bullish)
- **Use**: Add to long positions
**Hidden Bearish Divergence (Light Blue)**
- **Price**: Makes lower highs
- **OBV**: Makes higher highs
- **Signal**: Trend continuation (downtrend)
- **Label**: "隐藏看跌" (Hidden Bearish)
- **Use**: Add to short positions
#### 6. **Customizable Divergence Detection**
**Pivot Lookback Settings:**
- **Left Lookback**: Bars to the left of pivot (default: 5)
- **Right Lookback**: Bars to the right of pivot (default: 5)
- Determines how "extreme" a point must be to qualify as a pivot
**Range Settings:**
- **Maximum Range**: Maximum bars between pivots (default: 60)
- **Minimum Range**: Minimum bars between pivots (default: 5)
- Filters out too-close or too-distant divergences
**Display Options:**
- Toggle regular divergences on/off
- Toggle hidden divergences on/off
- Toggle divergence labels on/off
- Show only the divergences you need
### Configuration Settings
#### Smoothing Settings
- **Smoothing Type**: Choose MA type (None/SMA/EMA/SMMA/WMA/VWMA)
- **Smoothing Length**: Number of periods for smoothing (default: 21)
#### Calculation Settings
- **Timeframe**: Select calculation timeframe (empty = current chart)
#### Display Settings
- **Show OBV Line**: Toggle step line display
- **Show OBV Histogram**: Toggle histogram display
- **Show Background Color**: Toggle background coloring
- **Show Crossover Labels**: Toggle breakout/breakdown labels
#### Divergence Settings
- **Pivot Right Lookback**: Right bars for pivot detection (default: 5)
- **Pivot Left Lookback**: Left bars for pivot detection (default: 5)
- **Range Maximum**: Max bars between divergences (default: 60)
- **Range Minimum**: Min bars between divergences (default: 5)
- **Show Regular Divergences**: Enable/disable regular divergences
- **Show Regular Labels**: Enable/disable regular divergence labels
- **Show Hidden Divergences**: Enable/disable hidden divergences
- **Show Hidden Labels**: Enable/disable hidden divergence labels
### How to Use
#### For Trend Confirmation
1. **Identify Trend with Price**
- Uptrend: Higher highs and higher lows
- Downtrend: Lower highs and lower lows
2. **Confirm with OBV Oscillator**
- Strong uptrend: OBV oscillator staying positive
- Strong downtrend: OBV oscillator staying negative
- Weak trend: OBV oscillator frequently crossing zero
3. **Volume Confirmation**
- Trend with increasing OBV = Strong trend
- Trend with decreasing OBV = Weak trend (watch for reversal)
#### For Divergence Trading
1. **Enable Divergence Detection**
- Start with regular divergences only
- Add hidden divergences for trend continuation
2. **Wait for Divergence Signal**
- Yellow label = Potential bullish reversal
- Blue label = Potential bearish reversal
3. **Confirm with Price Action**
- Wait for support/resistance break
- Look for candlestick confirmation
- Check higher timeframe alignment
4. **Enter Trade**
- Enter after confirmation
- Set stop loss beyond recent swing
- Target based on previous swing or support/resistance
#### For Breakout Trading
1. **Enable Crossover Labels**
- Identify when oscillator crosses zero line
2. **Confirm Volume Strength**
- Strong breakouts have large oscillator moves
- Weak breakouts barely cross zero
3. **Trade Direction**
- "突破" label = Enter long
- "跌破" label = Enter short
4. **Manage Position**
- Exit when oscillator crosses back
- Use price structure for stops
#### For Multi-Timeframe Analysis
1. **Set Higher Timeframe**
- Example: On 15min chart, set timeframe to 1H or 4H
2. **Identify Higher Timeframe Trend**
- Positive oscillator = Uptrend bias
- Negative oscillator = Downtrend bias
3. **Trade with the Trend**
- Only take long signals in uptrend
- Only take short signals in downtrend
4. **Time Entries**
- Use current timeframe for precise entry
- Confirm with higher timeframe direction
### Trading Strategies
#### Strategy 1: Regular Divergence Reversal
**Setup:**
1. Price in strong trend (up or down)
2. Regular divergence appears
3. Price reaches support/resistance level
**Entry:**
- Bullish: After "看涨" label, when price breaks above recent high
- Bearish: After "看跌" label, when price breaks below recent low
**Stop Loss:**
- Bullish: Below divergence low
- Bearish: Above divergence high
**Exit:**
- Take profit at next major support/resistance
- Or when opposite divergence appears
**Best For:** Swing trading, reversal trading
#### Strategy 2: Hidden Divergence Continuation
**Setup:**
1. Clear trend established
2. Price pulls back (retracement)
3. Hidden divergence appears
**Entry:**
- Bullish: After "隐藏看涨" label, when price resumes uptrend
- Bearish: After "隐藏看跌" label, when price resumes downtrend
**Stop Loss:**
- Behind the pullback swing point
**Exit:**
- Trail stop as trend continues
- Exit on regular divergence (reversal signal)
**Best For:** Trend following, adding to positions
#### Strategy 3: Zero Line Crossover
**Setup:**
1. Enable crossover labels
2. Oscillator crosses zero line
3. Confirm with price structure break
**Entry:**
- "突破" label = Buy signal
- "跌破" label = Sell signal
**Stop Loss:**
- Below/above recent swing
**Exit:**
- When oscillator crosses back over zero
- Or at predetermined target
**Best For:** Momentum trading, quick trades
#### Strategy 4: Multi-Timeframe Confluence
**Setup:**
1. Set indicator to higher timeframe (e.g., 4H on 1H chart)
2. Wait for higher TF oscillator to be positive (uptrend) or negative (downtrend)
3. Look for entries on current timeframe aligned with higher TF
**Entry:**
- Long: When both timeframes show positive oscillator or bullish divergence
- Short: When both timeframes show negative oscillator or bearish divergence
**Stop Loss:**
- Based on current timeframe structure
**Exit:**
- When higher timeframe oscillator turns negative (for longs) or positive (for shorts)
**Best For:** Swing trading, high-probability setups
### Best Practices
#### Volume Analysis
1. **Strong Moves Need Volume**
- Price increase + Rising OBV = Healthy uptrend
- Price increase + Falling OBV = Weak uptrend (warning)
2. **Watch for Confirmation**
- New highs with new OBV highs = Confirmed
- New highs without new OBV highs = Potential divergence
3. **Consider Context**
- Low volume periods (Asian session, holidays) = Less reliable
- High volume periods (News, London/NY overlap) = More reliable
#### Divergence Trading Tips
1. **Not All Divergences Work**
- Wait for price confirmation
- Stronger in oversold/overbought areas
- Better at support/resistance levels
2. **Multiple Divergences**
- Multiple divergences on same trend = Stronger signal
- Quick divergence failures = Ignore and wait for next
3. **Timeframe Matters**
- Higher timeframe divergences = More reliable
- Lower timeframe divergences = More frequent, less reliable
#### Smoothing Selection
1. **No Smoothing (None)**
- Most sensitive, more signals
- More noise, more false signals
- Best for: Scalping, very active trading
2. **EMA (Default)**
- Balanced approach
- Good for most strategies
- Best for: Swing trading, day trading
3. **SMMA (RMA)**
- Very smooth, fewer signals
- Less responsive to sudden changes
- Best for: Position trading, longer timeframes
### Indicator Combinations
**With Moving Averages:**
- Use EMAs for trend direction
- OBV for volume confirmation
- Enter when both align
**With RSI:**
- RSI for overbought/oversold
- OBV for volume confirmation
- Divergences on both = Stronger signal
**With Price Action:**
- Support/resistance for levels
- OBV for strength confirmation
- Breakouts with positive OBV = More likely to succeed
**With Bias Indicator:**
- Bias for price deviation
- OBV for volume confirmation
- Both showing divergence = High probability reversal
### Common Patterns
1. **Accumulation**: OBV rising while price consolidates (breakout likely)
2. **Distribution**: OBV falling while price consolidates (breakdown likely)
3. **Confirmation**: OBV and price both making new highs/lows (trend strong)
4. **Divergence**: OBV and price moving opposite directions (reversal warning)
5. **False Breakout**: Price breaks but OBV doesn't confirm (likely to fail)
### Performance Tips
- Disable unused display features for faster loading
- Start with regular divergences only, add hidden later
- Use histogram for quick visual reference
- Enable crossover labels for clear entry signals
- Test different smoothing lengths for your market
### Alert Conditions
The indicator includes alerts for:
- Regular bullish divergence detected
- Regular bearish divergence detected
- Hidden bullish divergence detected
- Hidden bearish divergence detected
**How to Set Alerts:**
1. Click on the indicator name
2. Select "Add Alert"
3. Choose condition
4. Configure notification method
---
## 中文说明文档
### 概述
Scout Regiment - OBV(能量潮)是一个高级动量指标,结合成交量和价格变动来识别买卖压力的强度。该指标采用振荡器方法并具有背离检测功能,帮助交易者发现潜在的趋势反转并确认价格走势。
### 什么是OBV?
能量潮(OBV)是一个累积成交量指标,在上涨日累加成交量,在下跌日减去成交量:
- **上升的OBV**:积累(买入压力)
- **下降的OBV**:派发(卖出压力)
- **OBV振荡器**:OBV与其平滑移动平均线之间的差值,使背离更容易识别
### 核心功能
#### 1. **OBV振荡器显示**
该指标不显示原始OBV值,而是显示振荡器(OBV与其平滑线之间的差值):
**优势:**
- 更容易识别背离
- 趋势变化更清晰
- 对动量变化更敏感
- 零线作为参考点
**视觉元素:**
- **阶梯线**:主OBV振荡器线
- 绿色:正振荡器(积累)
- 红色:负振荡器(派发)
- **柱状图**:振荡器强度的可视化表示
- 绿色柱:零线以上
- 红色柱:零线以下
- **零线**:白色虚线作为参考
#### 2. **平滑选项**
选择多种移动平均类型来平滑OBV:
- **None**:原始OBV(最敏感)
- **SMA**:简单移动平均(等权重)
- **EMA**:指数移动平均(强调近期价格)- 默认
- **SMMA (RMA)**:平滑移动平均(非常平滑)
- **WMA**:加权移动平均(线性权重)
- **VWMA**:成交量加权移动平均(强调成交量)
**默认设置:**
- 类型:EMA
- 长度:21周期
- 适合:大多数市场状况
#### 3. **多时间框架分析**
- 在任何时间框架上计算OBV
- 在低时间框架图表上查看高时间框架动量
- 使交易与更大时间框架的成交量趋势保持一致
- 空字段 = 当前图表时间框架
#### 4. **视觉增强**
**背景颜色**
- 浅绿色:正振荡器(看涨成交量压力)
- 浅红色:负振荡器(看跌成交量压力)
- 可选显示,图表更清爽
**穿越标签**
- "突破":振荡器向上穿越零线
- "跌破":振荡器向下穿越零线
- 指示潜在趋势变化
- 可开关
#### 5. **全面的背离检测**
指标自动检测四种类型的背离:
**常规看涨背离(黄色)**
- **价格**:创新低
- **OBV**:创更高的低点
- **信号**:潜在向上反转
- **标签**:"看涨"
- **用途**:进入多头仓位
**常规看跌背离(蓝色)**
- **价格**:创新高
- **OBV**:创更低的高点
- **信号**:潜在向下反转
- **标签**:"看跌"
- **用途**:进入空头仓位或退出多头
**隐藏看涨背离(浅黄色)**
- **价格**:创更高的低点
- **OBV**:创更低的低点
- **信号**:趋势延续(上升趋势)
- **标签**:"隐藏看涨"
- **用途**:加仓多头
**隐藏看跌背离(浅蓝色)**
- **价格**:创更低的高点
- **OBV**:创更高的高点
- **信号**:趋势延续(下降趋势)
- **标签**:"隐藏看跌"
- **用途**:加仓空头
#### 6. **可自定义的背离检测**
**枢轴回溯设置:**
- **左侧回溯**:枢轴点左侧K线数(默认:5)
- **右侧回溯**:枢轴点右侧K线数(默认:5)
- 决定一个点要多"极端"才能成为枢轴点
**范围设置:**
- **最大范围**:枢轴点之间最大K线数(默认:60)
- **最小范围**:枢轴点之间最小K线数(默认:5)
- 过滤太近或太远的背离
**显示选项:**
- 开关常规背离
- 开关隐藏背离
- 开关背离标签
- 只显示需要的背离
### 配置设置
#### 平滑设置
- **平滑类型**:选择MA类型(None/SMA/EMA/SMMA/WMA/VWMA)
- **平滑长度**:平滑周期数(默认:21)
#### 计算设置
- **时间周期**:选择计算时间框架(空 = 当前图表)
#### 显示设置
- **显示OBV点线**:切换阶梯线显示
- **显示OBV柱状图**:切换柱状图显示
- **显示背景颜色**:切换背景着色
- **显示突破标签**:切换突破/跌破标签
#### 背离设置
- **枢轴右侧回溯**:枢轴检测右侧K线数(默认:5)
- **枢轴左侧回溯**:枢轴检测左侧K线数(默认:5)
- **回看范围最大值**:背离之间最大K线数(默认:60)
- **回看范围最小值**:背离之间最小K线数(默认:5)
- **显示常规背离**:启用/禁用常规背离
- **显示常规背离标签**:启用/禁用常规背离标签
- **显示隐藏背离**:启用/禁用隐藏背离
- **显示隐藏背离标签**:启用/禁用隐藏背离标签
### 使用方法
#### 趋势确认
1. **用价格识别趋势**
- 上升趋势:更高的高点和更高的低点
- 下降趋势:更低的高点和更低的低点
2. **用OBV振荡器确认**
- 强劲上升趋势:OBV振荡器保持正值
- 强劲下降趋势:OBV振荡器保持负值
- 弱势趋势:OBV振荡器频繁穿越零线
3. **成交量确认**
- 趋势伴随上升的OBV = 强趋势
- 趋势伴随下降的OBV = 弱趋势(注意反转)
#### 背离交易
1. **启用背离检测**
- 先从常规背离开始
- 添加隐藏背离用于趋势延续
2. **等待背离信号**
- 黄色标签 = 潜在看涨反转
- 蓝色标签 = 潜在看跌反转
3. **用价格行为确认**
- 等待支撑/阻力突破
- 寻找K线确认
- 检查更高时间框架对齐
4. **进入交易**
- 确认后进入
- 在近期波动之外设置止损
- 基于前一波动或支撑/阻力设定目标
#### 突破交易
1. **启用穿越标签**
- 识别振荡器何时穿越零线
2. **确认成交量强度**
- 强突破有大振荡器移动
- 弱突破勉强穿越零线
3. **交易方向**
- "突破"标签 = 进入多头
- "跌破"标签 = 进入空头
4. **管理仓位**
- 振荡器反向穿越时退出
- 使用价格结构设置止损
#### 多时间框架分析
1. **设置更高时间框架**
- 例如:在15分钟图上,设置时间框架为1H或4H
2. **识别更高时间框架趋势**
- 正振荡器 = 上升趋势偏向
- 负振荡器 = 下降趋势偏向
3. **顺趋势交易**
- 仅在上升趋势中接受多头信号
- 仅在下降趋势中接受空头信号
4. **把握入场时机**
- 使用当前时间框架进行精确进入
- 用更高时间框架方向确认
### 交易策略
#### 策略1:常规背离反转
**设置:**
1. 价格处于强趋势(上涨或下跌)
2. 出现常规背离
3. 价格到达支撑/阻力水平
**入场:**
- 看涨:在"看涨"标签后,价格突破近期高点时
- 看跌:在"看跌"标签后,价格跌破近期低点时
**止损:**
- 看涨:背离低点之下
- 看跌:背离高点之上
**退出:**
- 在下一个主要支撑/阻力获利
- 或出现相反背离时
**适合:**波段交易、反转交易
#### 策略2:隐藏背离延续
**设置:**
1. 建立明确趋势
2. 价格回调(回撤)
3. 出现隐藏背离
**入场:**
- 看涨:在"隐藏看涨"标签后,价格恢复上升趋势时
- 看跌:在"隐藏看跌"标签后,价格恢复下降趋势时
**止损:**
- 在回调波动点之后
**退出:**
- 随着趋势延续移动止损
- 出现常规背离(反转信号)时退出
**适合:**趋势跟随、加仓
#### 策略3:零线穿越
**设置:**
1. 启用穿越标签
2. 振荡器穿越零线
3. 用价格结构突破确认
**入场:**
- "突破"标签 = 买入信号
- "跌破"标签 = 卖出信号
**止损:**
- 近期波动之下/之上
**退出:**
- 振荡器反向穿越零线时
- 或在预定目标
**适合:**动量交易、快速交易
#### 策略4:多时间框架汇合
**设置:**
1. 设置指标到更高时间框架(例如,在1H图上设置4H)
2. 等待更高TF振荡器为正(上升趋势)或负(下降趋势)
3. 在当前时间框架上寻找与更高TF一致的入场机会
**入场:**
- 多头:两个时间框架都显示正振荡器或看涨背离时
- 空头:两个时间框架都显示负振荡器或看跌背离时
**止损:**
- 基于当前时间框架结构
**退出:**
- 更高时间框架振荡器变为负(多头)或正(空头)时
**适合:**波段交易、高概率设置
### 最佳实践
#### 成交量分析
1. **强势波动需要成交量**
- 价格上涨 + 上升的OBV = 健康上升趋势
- 价格上涨 + 下降的OBV = 弱上升趋势(警告)
2. **注意确认**
- 新高伴随新OBV高点 = 已确认
- 新高没有新OBV高点 = 潜在背离
3. **考虑背景**
- 低成交量期(亚洲时段、假期)= 可靠性较低
- 高成交量期(新闻、伦敦/纽约重叠)= 更可靠
#### 背离交易技巧
1. **不是所有背离都有效**
- 等待价格确认
- 在超卖/超买区域更强
- 在支撑/阻力水平更好
2. **多重背离**
- 同一趋势上多个背离 = 更强信号
- 背离快速失败 = 忽略并等待下一个
3. **时间框架重要**
- 更高时间框架背离 = 更可靠
- 更低时间框架背离 = 更频繁,可靠性较低
#### 平滑选择
1. **无平滑(None)**
- 最敏感,更多信号
- 更多噪音,更多假信号
- 适合:剥头皮、非常活跃的交易
2. **EMA(默认)**
- 平衡方法
- 适合大多数策略
- 适合:波段交易、日内交易
3. **SMMA (RMA)**
- 非常平滑,更少信号
- 对突然变化响应较慢
- 适合:仓位交易、更长时间框架
### 指标组合
**与移动平均线配合:**
- 使用EMA确定趋势方向
- OBV确认成交量
- 两者一致时进入
**与RSI配合:**
- RSI用于超买超卖
- OBV用于成交量确认
- 两者都背离 = 更强信号
**与价格行为配合:**
- 支撑/阻力确定水平
- OBV确认强度
- 正OBV的突破 = 更可能成功
**与Bias指标配合:**
- Bias用于价格偏离
- OBV用于成交量确认
- 两者都显示背离 = 高概率反转
### 常见形态
1. **积累**:OBV上升而价格盘整(突破可能)
2. **派发**:OBV下降而价格盘整(跌破可能)
3. **确认**:OBV和价格都创新高/新低(趋势强劲)
4. **背离**:OBV和价格反向移动(反转警告)
5. **假突破**:价格突破但OBV不确认(可能失败)
### 性能提示
- 禁用未使用的显示功能以加快加载
- 先从常规背离开始,稍后添加隐藏背离
- 使用柱状图快速视觉参考
- 启用穿越标签以获得清晰的入场信号
- 为您的市场测试不同的平滑长度
### 警报条件
指标包含以下警报:
- 检测到常规看涨背离
- 检测到常规看跌背离
- 检测到隐藏看涨背离
- 检测到隐藏看跌背离
**如何设置警报:**
1. 点击指标名称
2. 选择"添加警报"
3. 选择条件
4. 配置通知方法
---
## Technical Support
For questions or issues, please refer to the TradingView community or contact the indicator creator.
## 技术支持
如有问题,请参考TradingView社区或联系指标创建者。
